Article by IG Senior Market Analyst Axel Rudolph
FTSE 100, CAC 40, DAX40: Analysis and Charts
FTSE 100 continues to be side-lined
The FTSE 100 still range trades below its 55-day simple moving average (SMA) at 7,506 following the chancellor’s autumn statement which despite promising significant tax cuts leaves the UK tax burden at the highest level since 1948.
As the US earnings season draws to an end ahead of Thanksgiving and Black Friday, trading volumes will likely be light on Thursday.
While the UK blue chip index remains above Tuesday’s 7,446 low, it stays within an uptrend and may still revisit Friday’s 7,516 high. Further up sits the current November peak at 7,535, an advance above which would target the 200-day simple moving average (SMA) at 7,592.
Minor support can be found around the 9 November high at 7,466 ahead of Tuesday’s 7,446 low. Below it, last Thursday’s low can be made out at 7,430, followed by the early September and early October lows at 7,384 to 7,369.
FTSE 100 Daily Chart
See How IG Client Sentiment Can Help You Make Trading Decisions
| Change in | Longs | Shorts | OI |
| Daily | 6% | -7% | 2% |
| Weekly | 4% | 0% | 3% |
CAC 40 rises above 200-day SMA
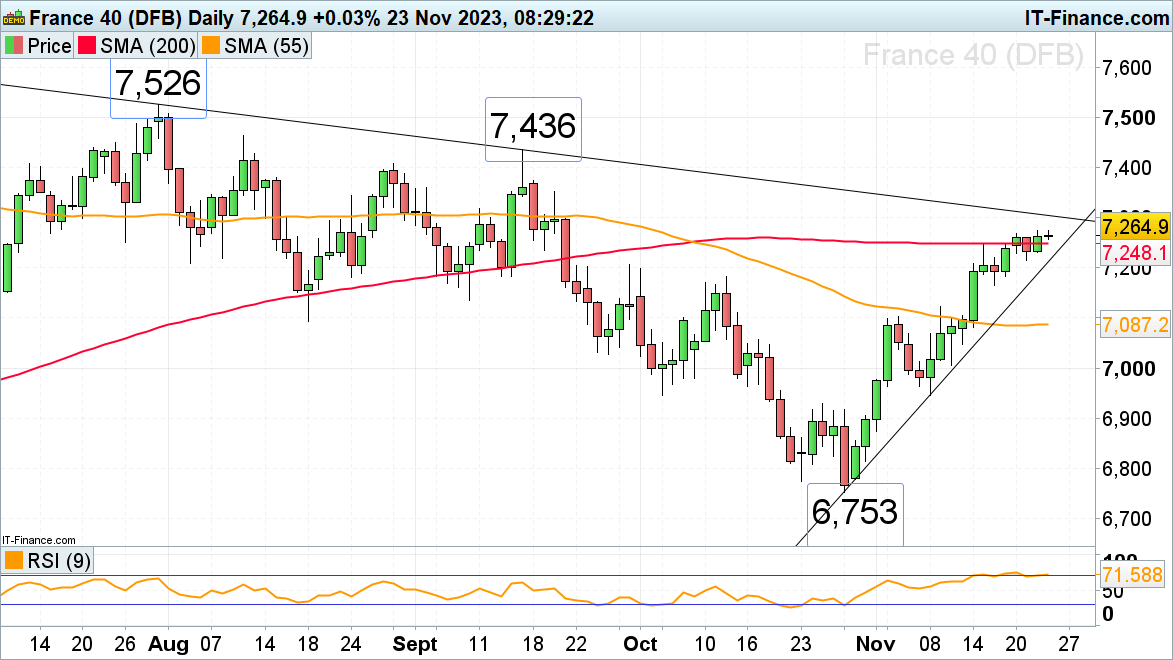
The French CAC 40 has this week managed to rise and stay above its 200-day simple moving average (SMA) at 7,248 ahead of Thursday’s French manufacturing and services PMIs with the July-to-November downtrend line at 7,306 remaining in view.
Above it beckons the late August and September highs at 7,407 to 7,436.
Minor support below the 200-day SMA can be spotted at Tuesday’s low and along the October-to-November uptrend line at 7,214. While it underpins, the short-term uptrend remains intact.
CAC 40 Daily Chart

Recommended by IG
How to Trade FX with Your Stock Trading Strategy
DAX 40 is drawn to the 16,000 mark
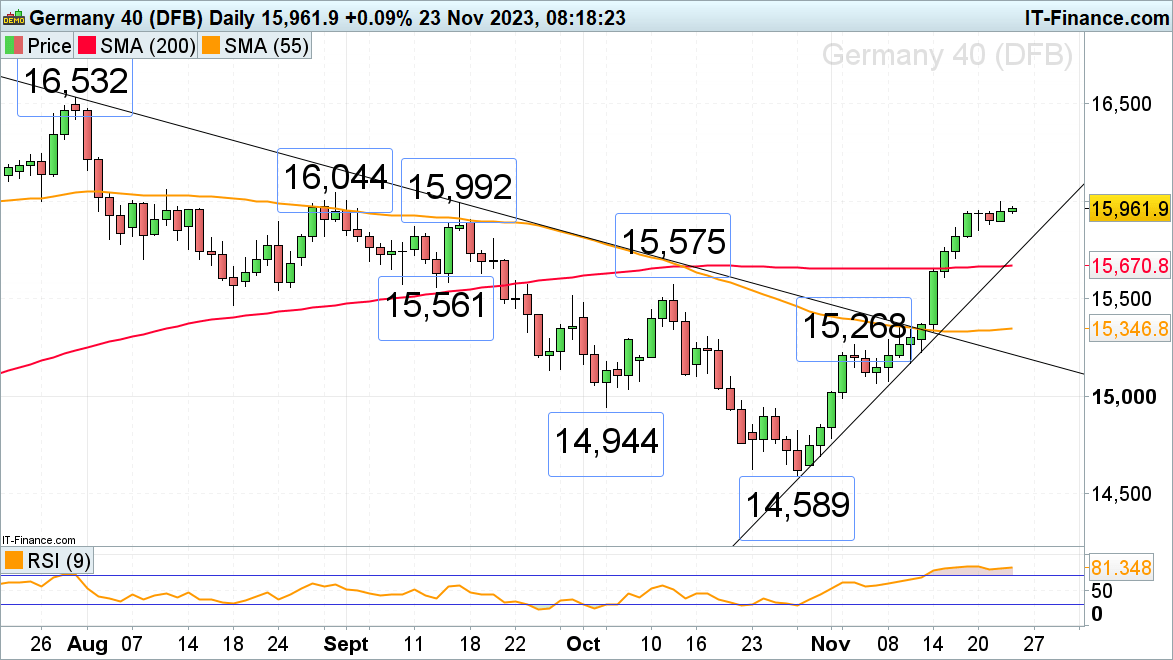
The DAX 40 continues to gradually rise towards the psychological 16,000 mark as German manufacturing and services PMIs may add more color to the state of the economy.
On Wednesday the index reached the August and September highs at 15,992 to 16,044 which short-term capped but is back in sight today.
Minor support below Thursday’s high at 15,867 can be seen at last Thursday’s 15,710 low. Further down slithers the 200-day simple moving average at 15,671.
DAX 40 Daily Chart

Read the full article here

