EUR/USD Analysis
- EUR/USD finds resistance at significant Fibonacci level – EU and US inflation data to guide shorter-term price action later in the week
- Disinflation in Europe could lead the way for developed economies
- The analysis in this article makes use of chart patterns and key support and resistance levels. For more information visit our comprehensive education library
EUR/USD Finds Temporary Resistance Ahead of High Importance Data
EUR/USD is currently testing the 21 November high and continues to trade above the 200-day simple moving average (SMA). The bullish run may face another test in the form of US GDP data (second estimate) later this week after estimates point to an even hotter Q3 performance from the world’s largest economy – potentially weighing on the recent bullish EUR/USD momentum.
Better than expected EU inflation data (lower than forecasts) could also provide a catalyst for a pullback alongside other signs of slowing momentum provided by the RSI about to enter overbought territory and the MACD heading for a bearish crossover. However, it must be noted that neither of these conditions have been met yet and in that case, levels to the upside remain in play. Resistance at 1.0960 followed all the way up at 1.1100 with little in between. Support is at 1.0831 and the 200 SMA.
EUR/USD Daily Chart
Source: TradingView, prepared by Richard Snow
Recommended by Richard Snow
How to Trade EUR/USD
Event Risk for the Remainder of the Week
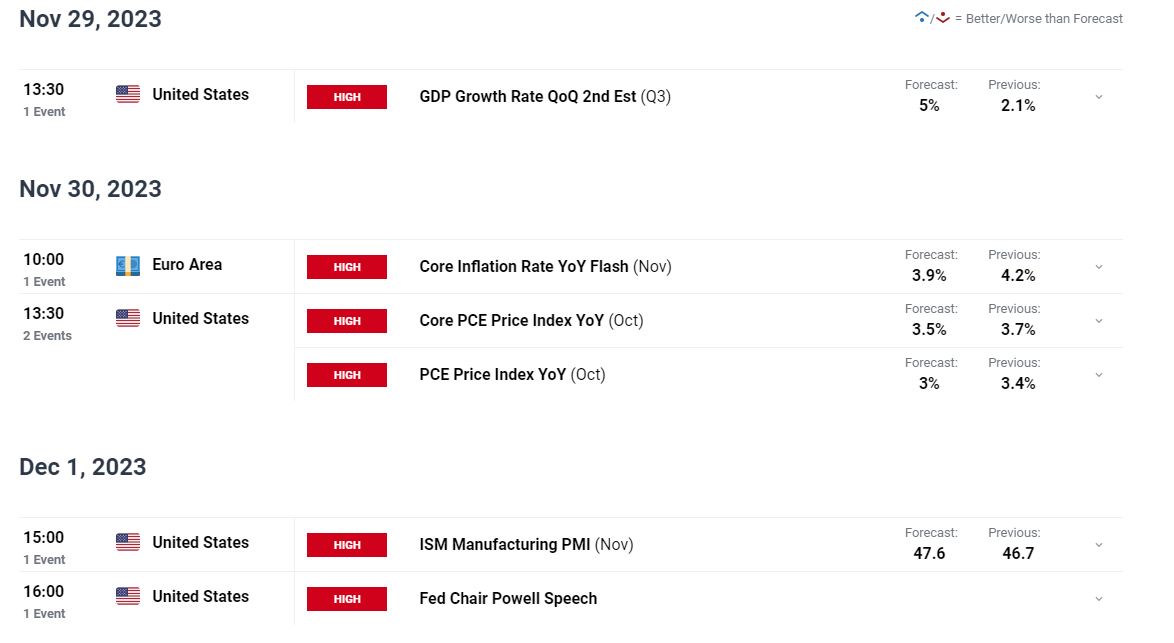
US GDP for the third quarter is due for its second estimate after the advance figure revealed a massive 4.9% annualised growth rate for the US economy. Despite economic data easing in Q4, it appears the gains made in Q3 will be ringfenced as consensus estimates reveal a slightly larger 5% estimate as more data has filtered through. EUR/USD may find temporary resistance should we see an upward revision but expect the consolidation to be short-lived as more current (weaker) data provides a more accurate indication of the economy.
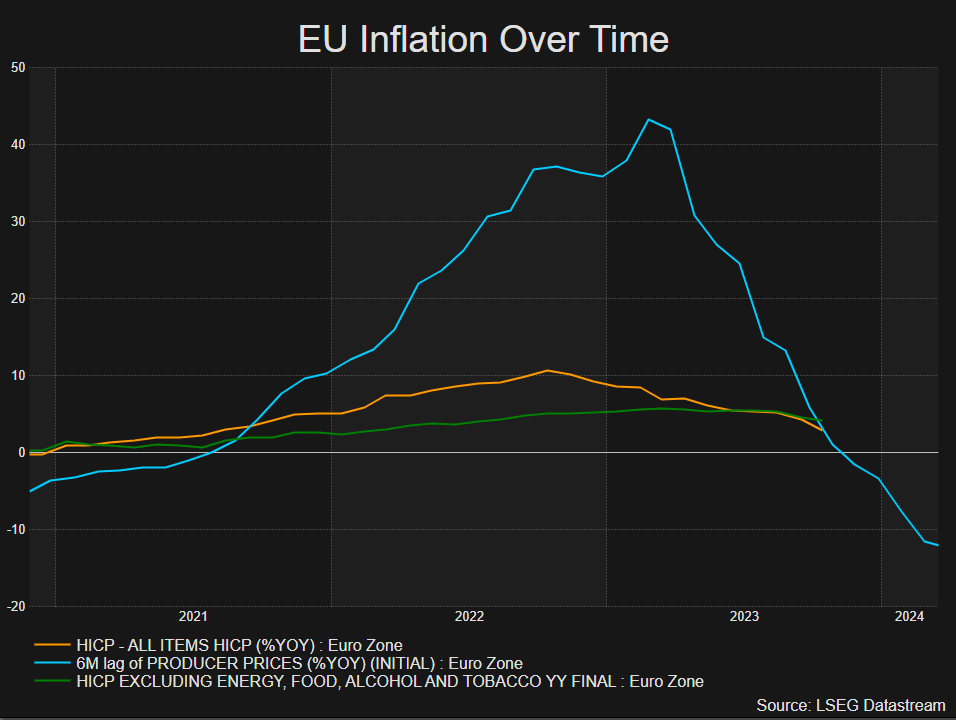
EU inflation data for November is estimated to reveal another encouraging drop for November, both in the headline measure and the core readings (inflation minus volatile energy and food prices). The chart below hints that the European Union could witness the fastest decline in inflation when compared to other developed nations. Producer price inflation measures upstream price trends at factory gates which eventually filter down into the broader economy with a lag of around 6 months. PPI is heavily negative (deflationary), suggesting more widely followed measures of inflation are likely to follow soon which would force the ECB to seriously consider cutting interest rates in an attempt to revitalise the anaemic economy. Longer-term, such an outcome would result in a weaker euro as interest rate differentials widen.
EU Inflation (headline HICP inflation, core HICP inflation and PPI)

Source: TradingView, prepared by Richard Snow

Customize and filter live economic data via our DailyFX economic calendar
Recommended by Richard Snow
Trading Forex News: The Strategy
— Written by Richard Snow for DailyFX.com
Contact and follow Richard on Twitter: @RichardSnowFX
Read the full article here

