Ripple has been one of the large-cap coins experiencing a significant loss in value over the last couple of weeks.
However, the market outlook still remains bullish for the mid-term.
By Edris Derakhshi (TradingRage)
The USDT Paired Chart
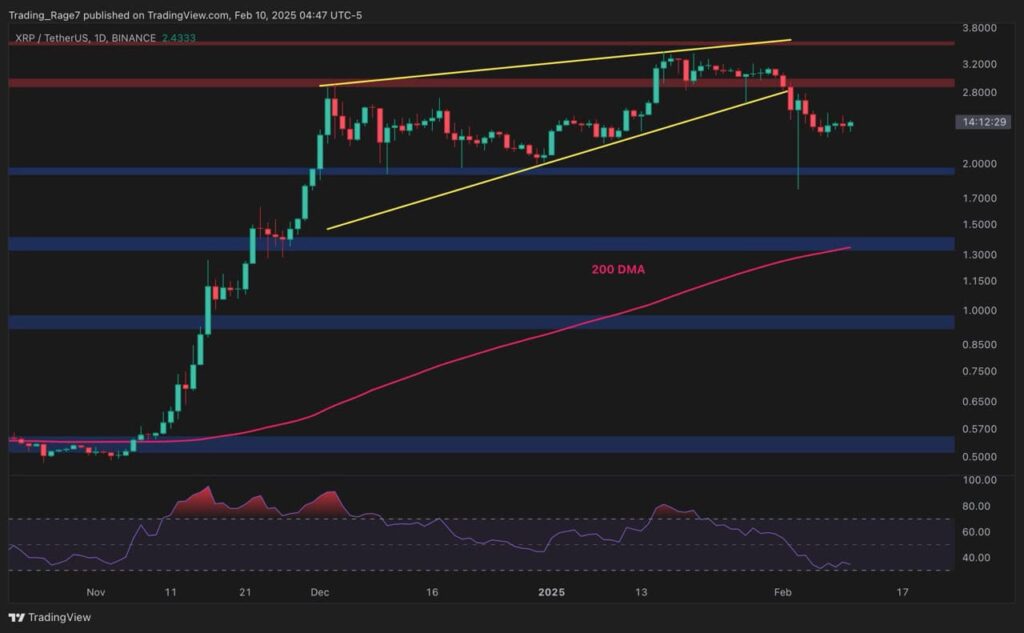
On the USDT pair, the asset has recently broken below a large rising wedge pattern after failing to climb above the $3.5 resistance zone. The $3 level is also lost now, as the price is consolidating around the $2.5 mark.
Yet, while a deeper correction toward the $2 level is probable, the overall trend remains bullish as long as XRP is trading above its 200-day moving average, currently located around the $1.3 mark.
The BTC Paired Chart
The price action on the XRP/BTC pair’s daily chart is very similar to that of the USDT pair, as the market has dropped below the ascending channel demonstrated on it and is likely to decline toward the 2,000 SAT, with the RSI indicating that momentum is bearish.
Yet, as long as the 200-day moving average remains below that level, Ripple will probably appreciate in value against Bitcoin.
Read the full article here

