
Ethereum remains under sustained downside pressure after the February liquidation cascade, with the price now stabilizing around the mid-$1,800s.
The broader structure still reflects a cyclical correction rather than a completed bottom, but short-term momentum has cooled, and the market is attempting to build a base above a major higher-timeframe demand region.
Ethereum Price Analysis: The Daily Chart
On the daily chart, ETH trades within a well-defined descending channel, with the price currently hugging the lower half of the structure near $1,800–$1,850. The breakdown from the $2,300–$2,400 support block and the rejection well below the declining 100-day and 200-day moving averages confirm a bearish medium-term trend, while the daily RSI remains depressed near oversold territory, consistent with a strongly extended move.
The immediate technical focus is the horizontal demand band around $1,750–$1,800, and sustained consolidation above this area could allow a mean-reversion bounce toward the $2,000–$2,200 zone, whereas a decisive loss of it would open the door toward deeper supports closer to $1,500–$1,600 and the lower boundary of the channel.
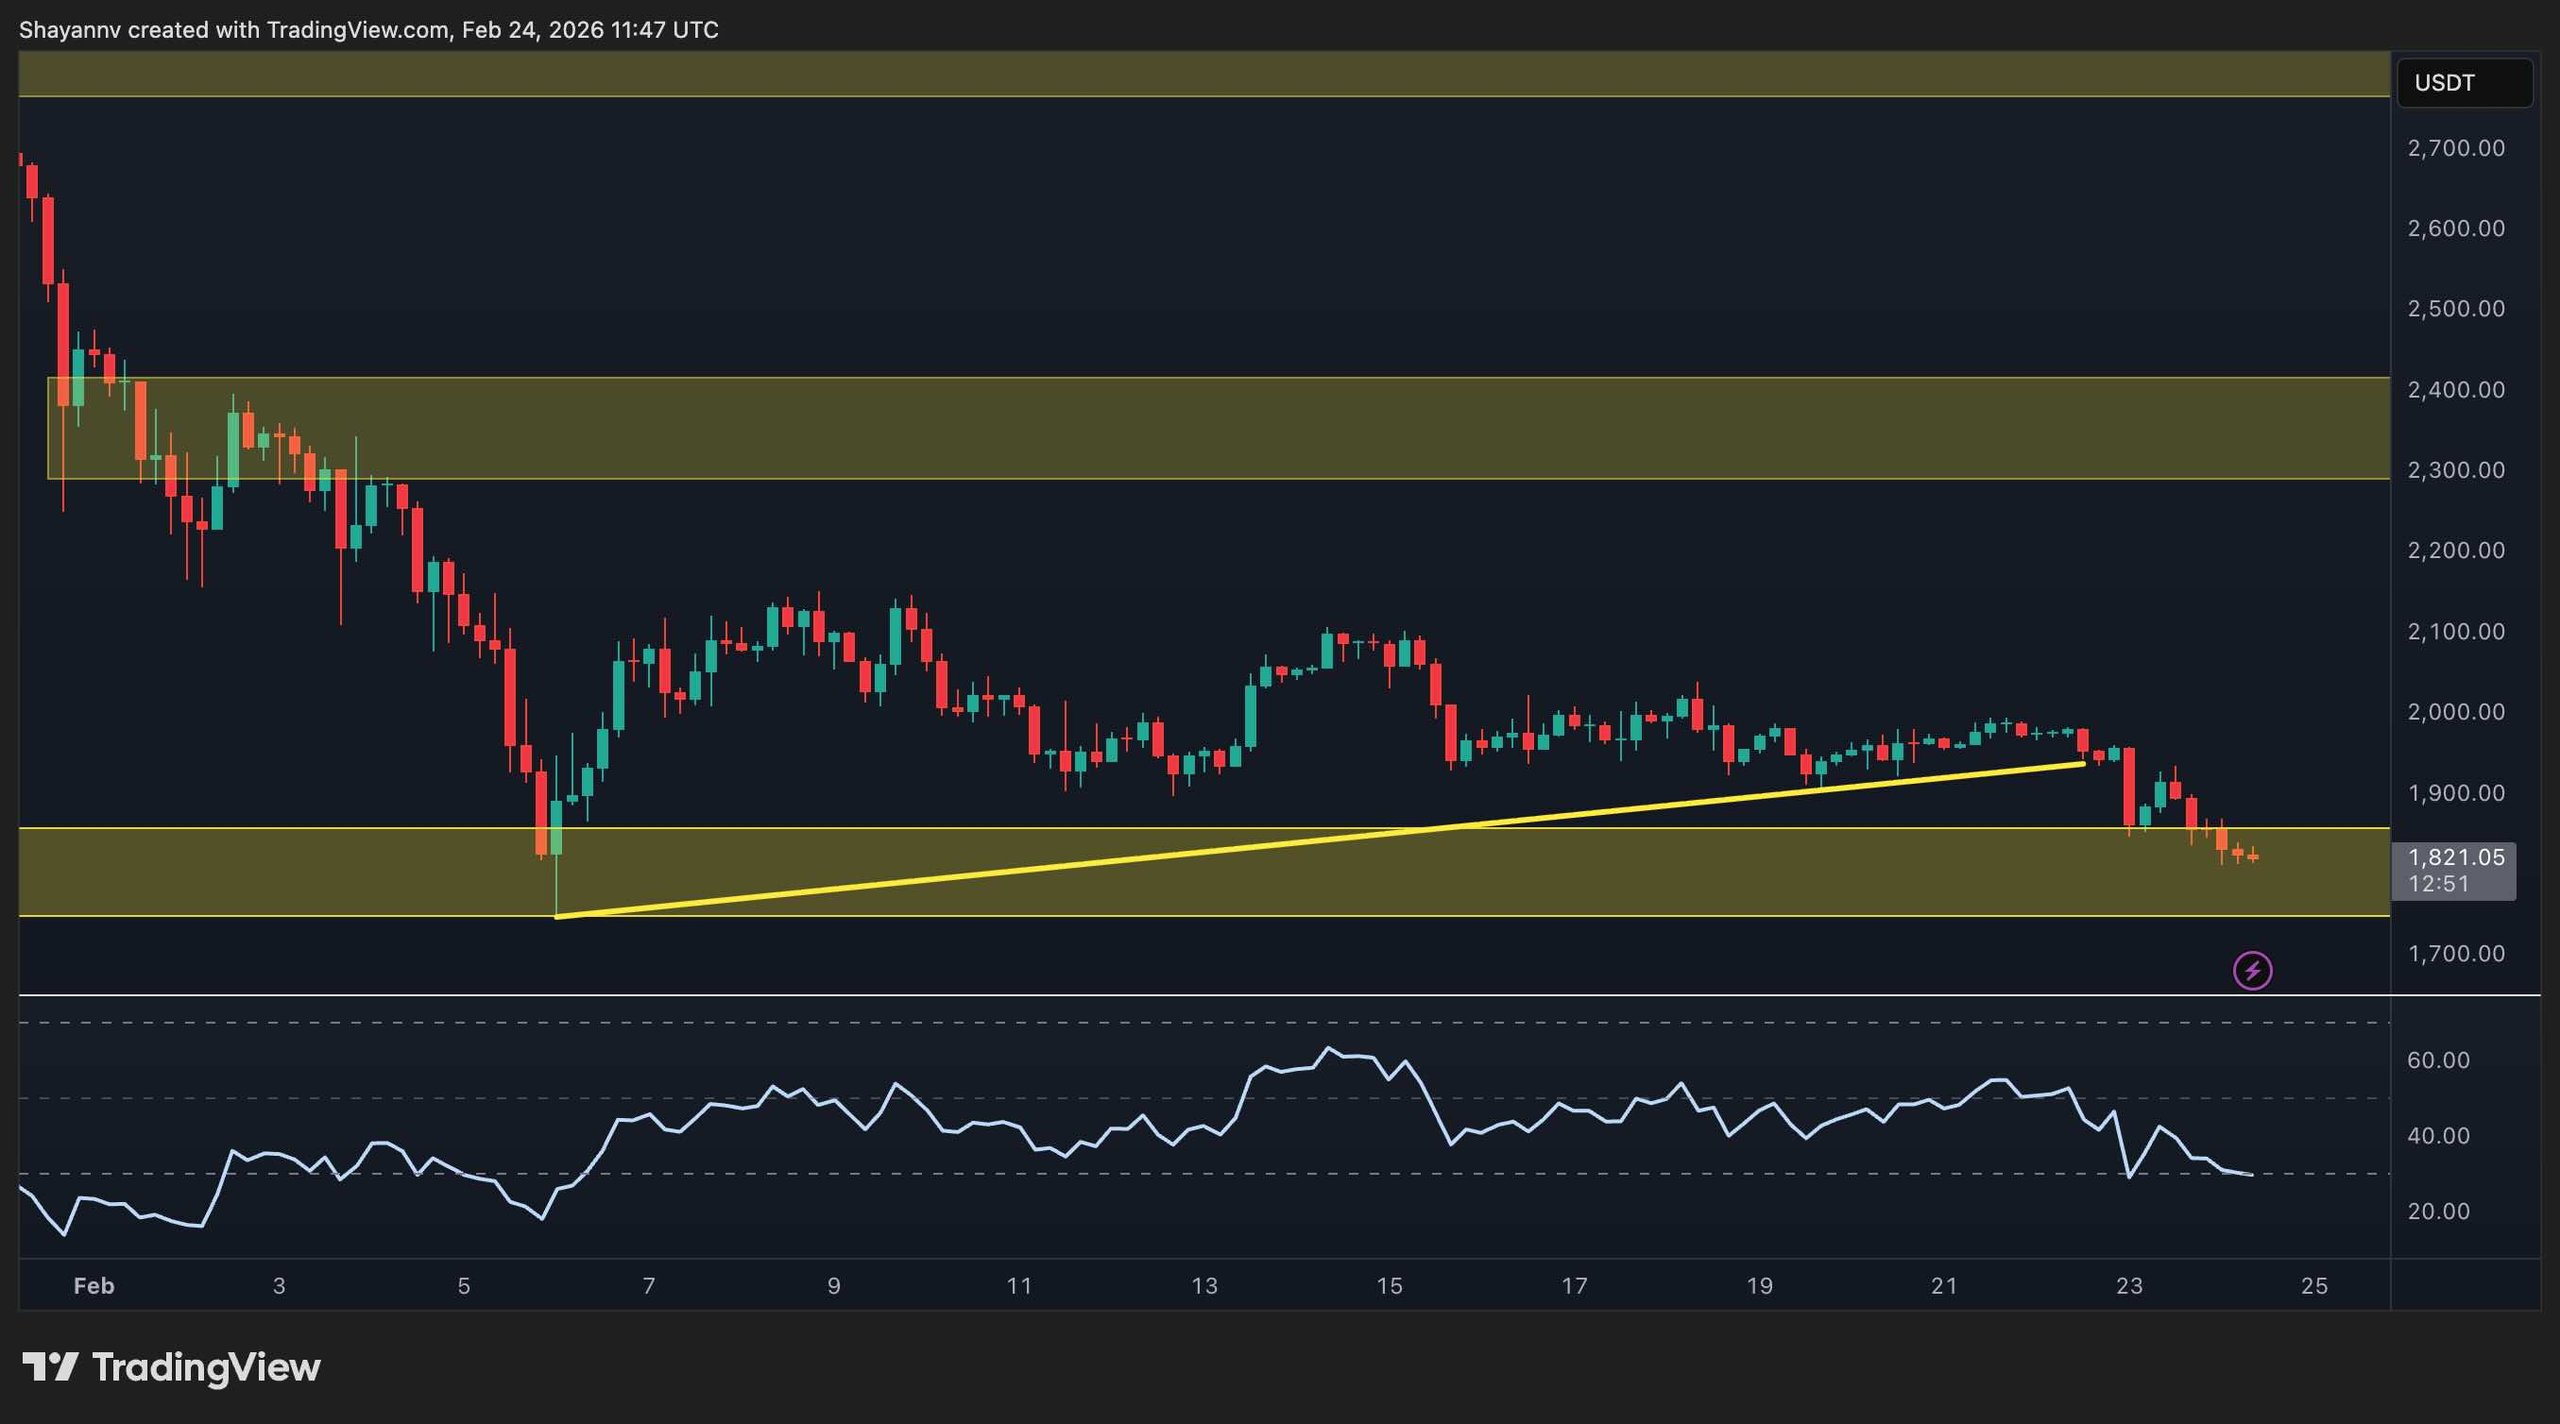
ETH/USDT 4-Hour Chart
On the 4-hour chart, the prior ascending support line originating from the early-February low has been broken, and the asset is now consolidating just below that trendline inside the same $1,750–$1,850 demand zone. Short-term momentum is weak but no longer accelerating lower, with the RSI flattening after an oversold print, which often precedes either a sideways consolidation or a corrective rebound.
As long as the market holds above the recent intraday lows around the $1,750 mark, the structure allows for a retracement back toward $1,900–$1,950, where the former range floor and short-term moving averages converge. Failure to defend the $1,780 area would likely trigger another round of selling toward the next liquidity pocket below $1,700.
On-Chain Analysis
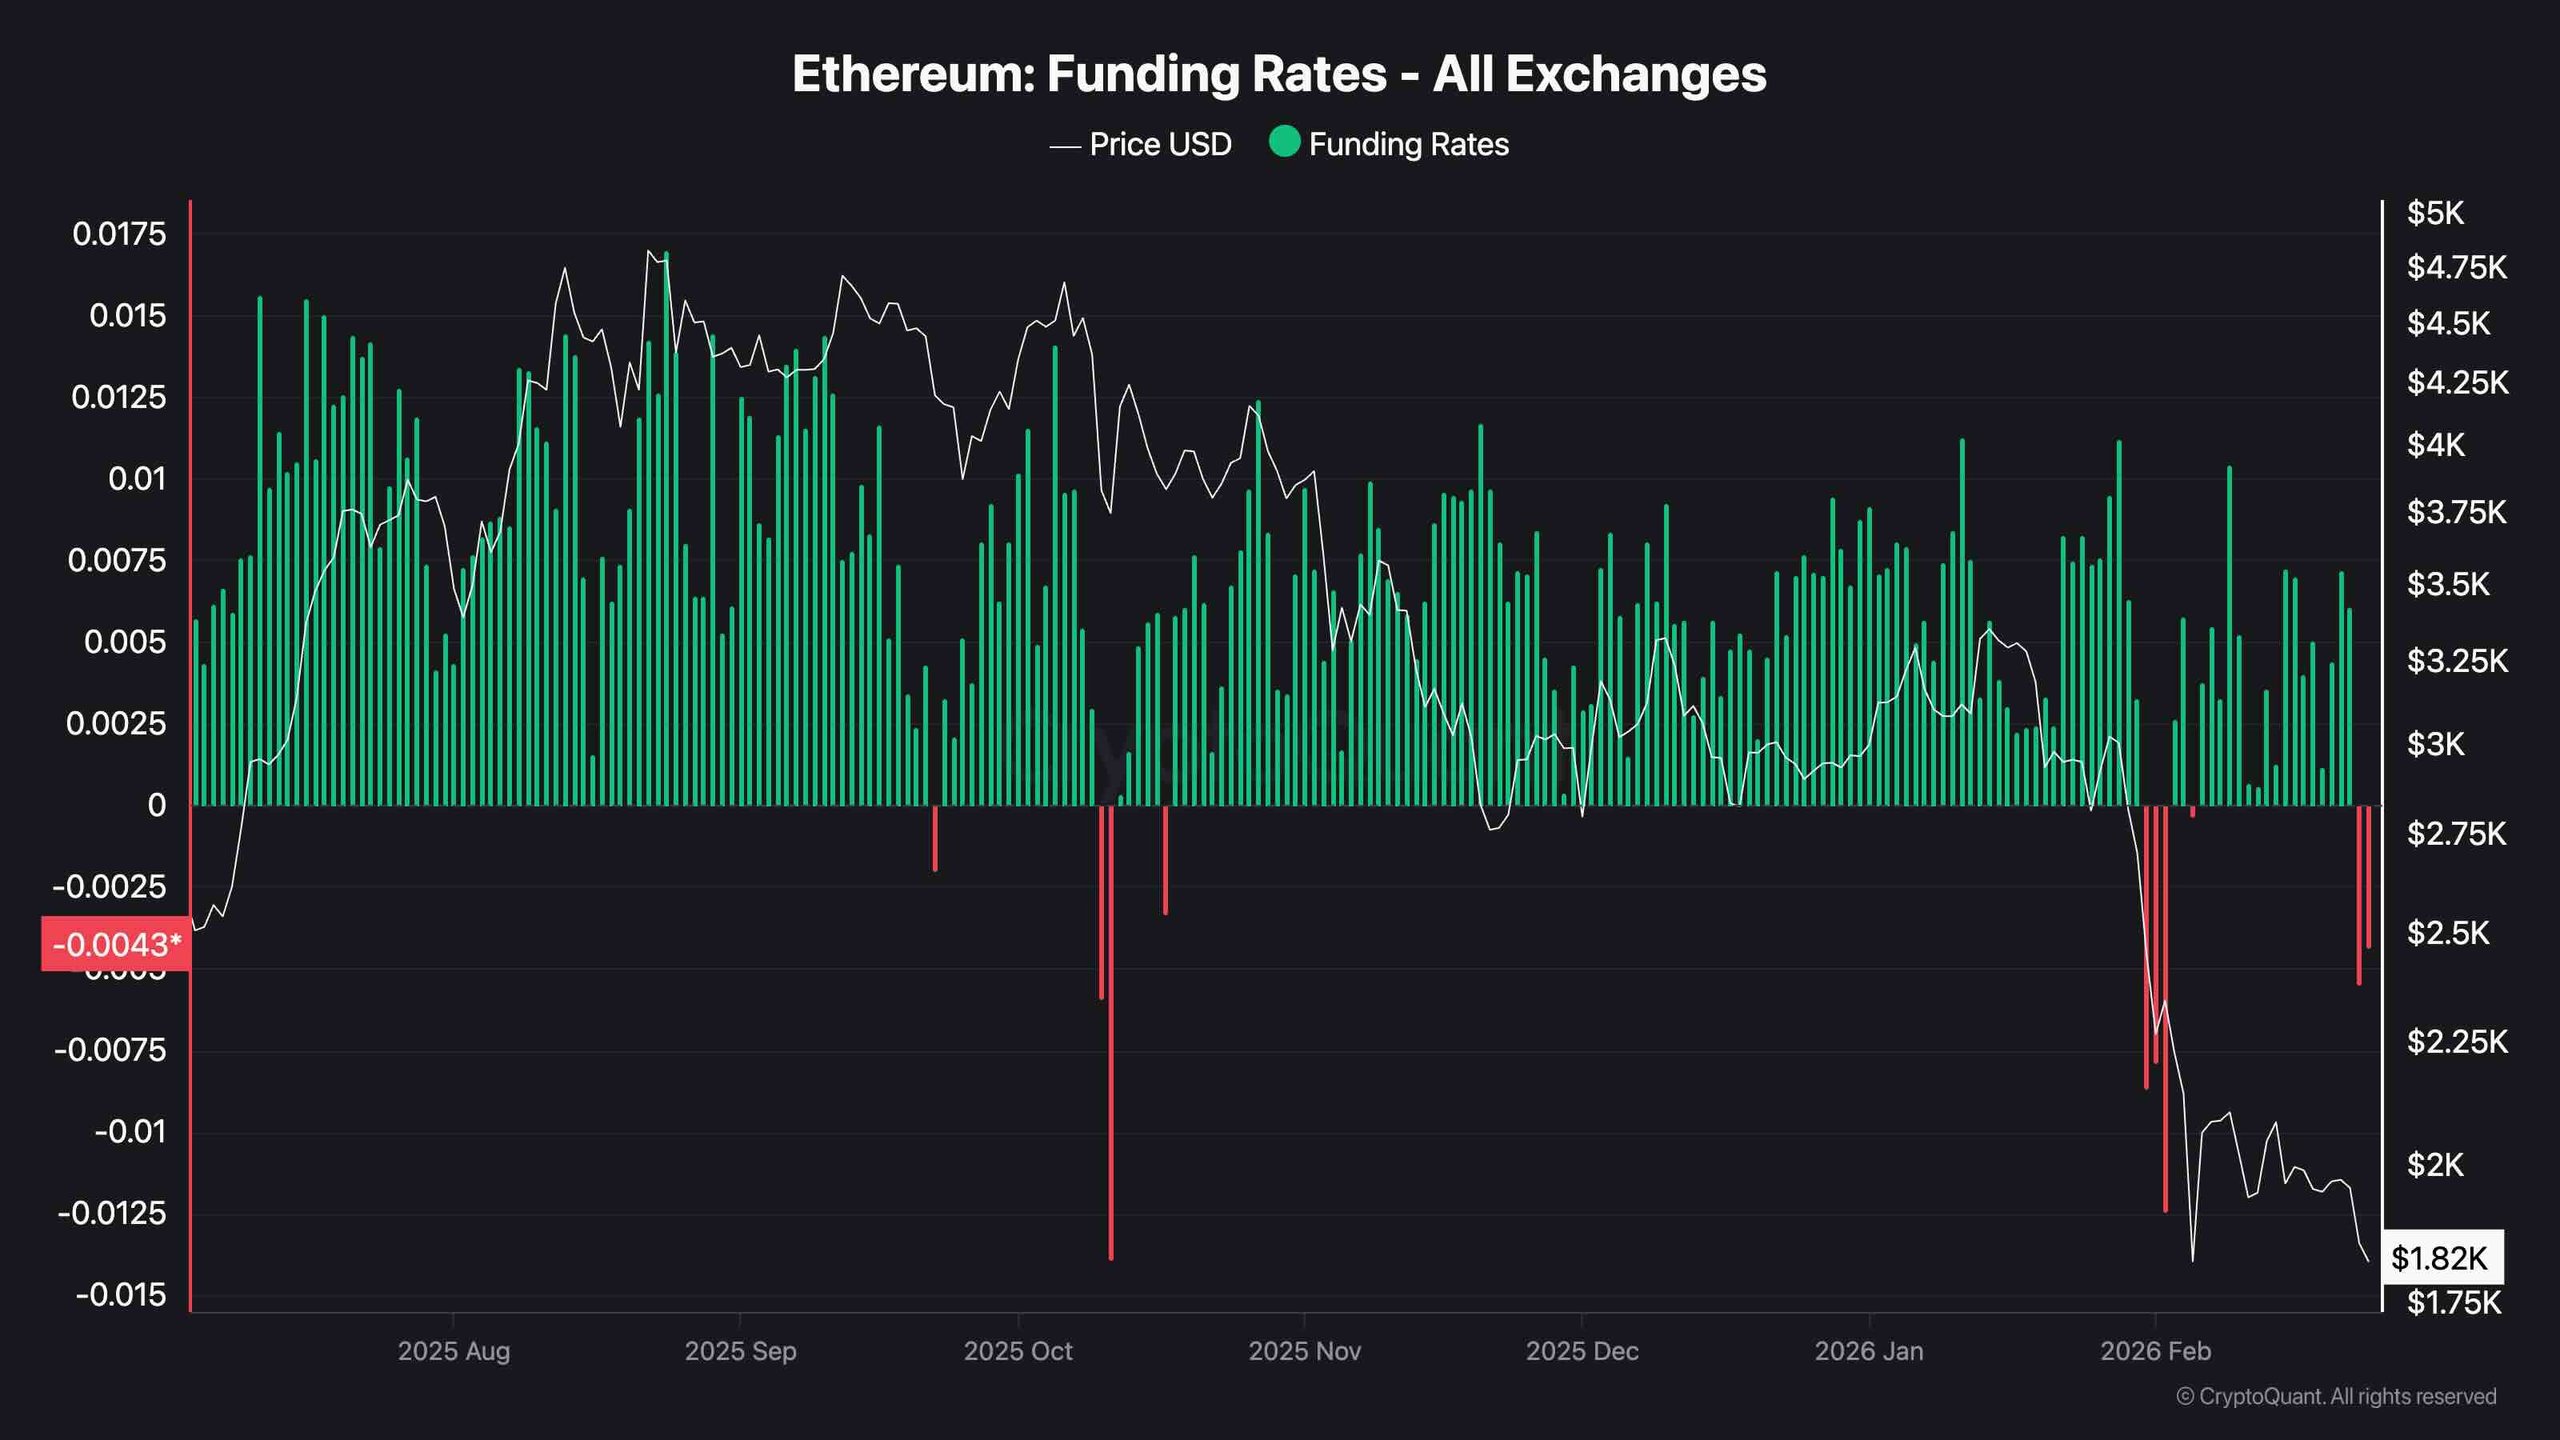
Perpetual futures positioning reflects a markedly defensive stance: funding rates across major exchanges have flipped sharply negative and remain below zero after the recent decline, indicating that short positions are paying longs and that the derivatives market is skewed toward bearish exposure.
This shift follows a prolonged period of mostly positive funding during the prior uptrend, suggesting that a large portion of the current move has been driven by aggressive shorting and long liquidations rather than organic spot selling alone.
While persistent negative funding can reinforce downside pressure if spot demand stays weak, in combination with an oversold technical backdrop, it also creates the preconditions for a short squeeze should price stabilize and buyers step in around the present support cluster.
Read the full article here