
Bitcoin (BTC) price has been consolidating in a wide range between $76,600 to $87,500 since March 11.
According to technical and onchain indicators, Bitcoin’s consolidation may continue for some time. The key question that remains is when Bitcoin will break out of the current multiweek range.
XRP/USD daily chart. Source: Cointelegraph/TradingView
BTC price must reclaim $90K to end consolidation
Bitcoin may continue consolidating in its current range for a bit longer, particularly if $90,000 is not reclaimed, says one popular crypto analyst.
In a March 23 post on X, market analyst Daan Crypto Trades said:
-
Since March 11, BTC price action has been “choppy,” failing to produce a streak of green or red candles in the daily timeframe.
-
Sentiment and momentum will return in favor of bulls once the price retakes the previous range, which sits above $90,000.
-
If that happens, it “would lead to new highs pretty soon.”
-
Failure to do that will risk a retest the “2024/Summer consolidation” between $73,000 and $74,000, which should at least offer some support.
“Right now, the price is pretty much in the middle of nowhere.”
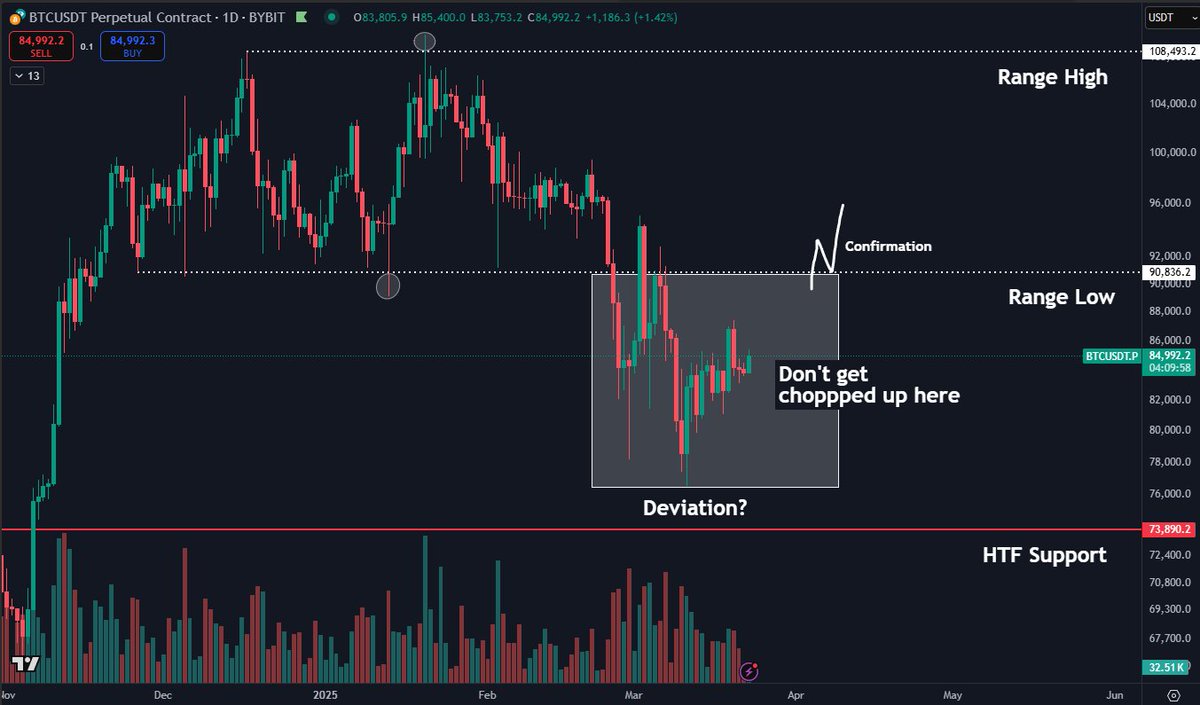
BTC/USD daily chart. Source: Daan Crypto Trades
This was echoed by analyst Jelle, who said Bitcoin’s current consolidation cycle could continue until the price breaks above $90,000.
“Break that, and things will look very, very good once more.”
For fellow analyst Rekt Capital, Bitcoin must produce a weekly close above $88,000 to confirm a higher breakout.
Related: RSI breaks 4-month downtrend: 5 things to know in Bitcoin this week
In a March 24 post, the analyst said:
-
Bitcoin is close to retesting the resistance provided by the 21-week exponential moving average (EMA) (green), the top of a triangular market structure produced by the 21 EMA and the 50 EMA.
-
BTC will need a weekly close above the green EMA at $88,400, followed by a retest to confirm a breakout toward $93,500.
-
Similar price action occurred in 2021 when Bitcoin produced a weekly close above $40,000, with the following week’s candlestick retesting the level before moving upward.
“If history repeats, that sort of volatility around the 21-week EMA shouldn’t come as a surprise.”
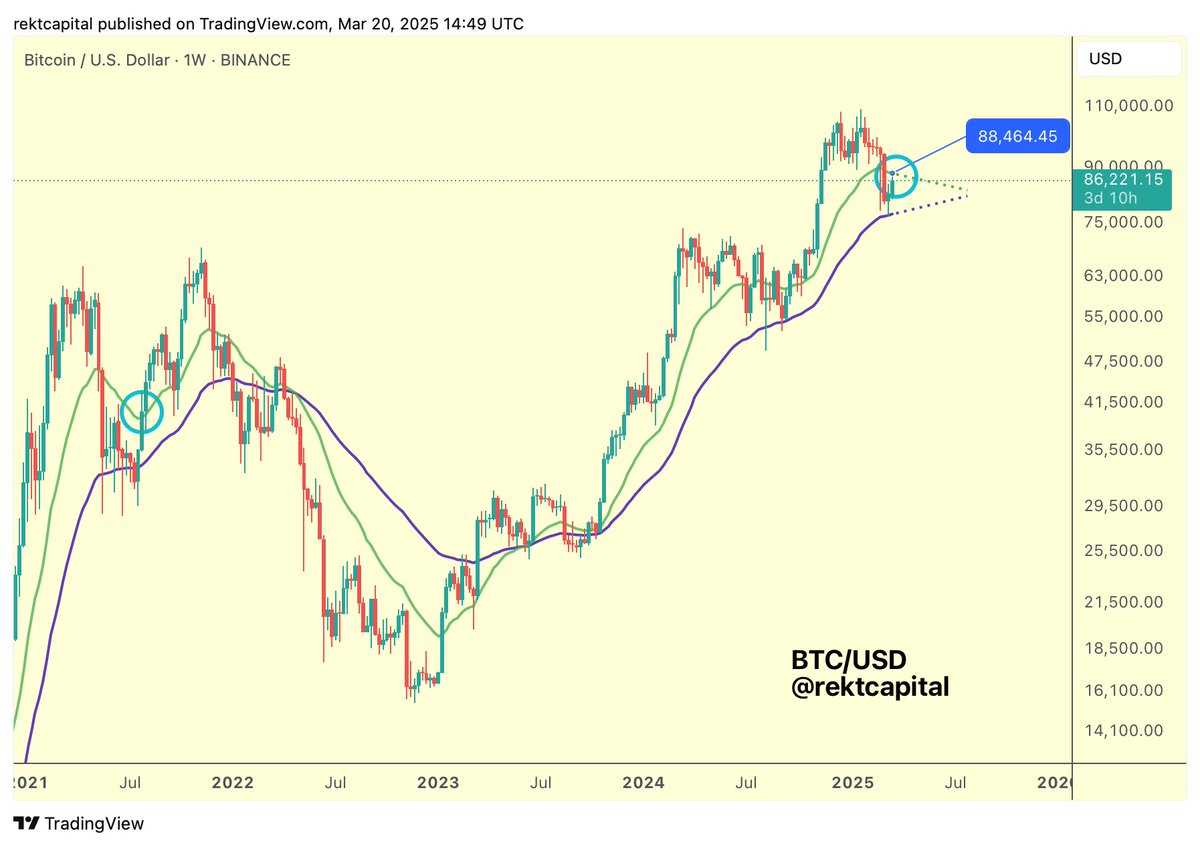
BTC/USD weekly chart. Source: Rekt Capital
BTC funding rates remain subdued
One of the clearest signs that there is more choppy price action ahead for Bitcoin is the presence of negative funding rates and decreasing open interest (OI) in its futures markets.
Key points:
-
Funding rates are periodic payments made between long and short traders in perpetual futures contracts to keep prices aligned with the spot market.
-
When this metric turns negative, shorts pay longs, indicating bearish sentiment.
-
BTC funding rates are around 0%, indicating indecisiveness in the market.
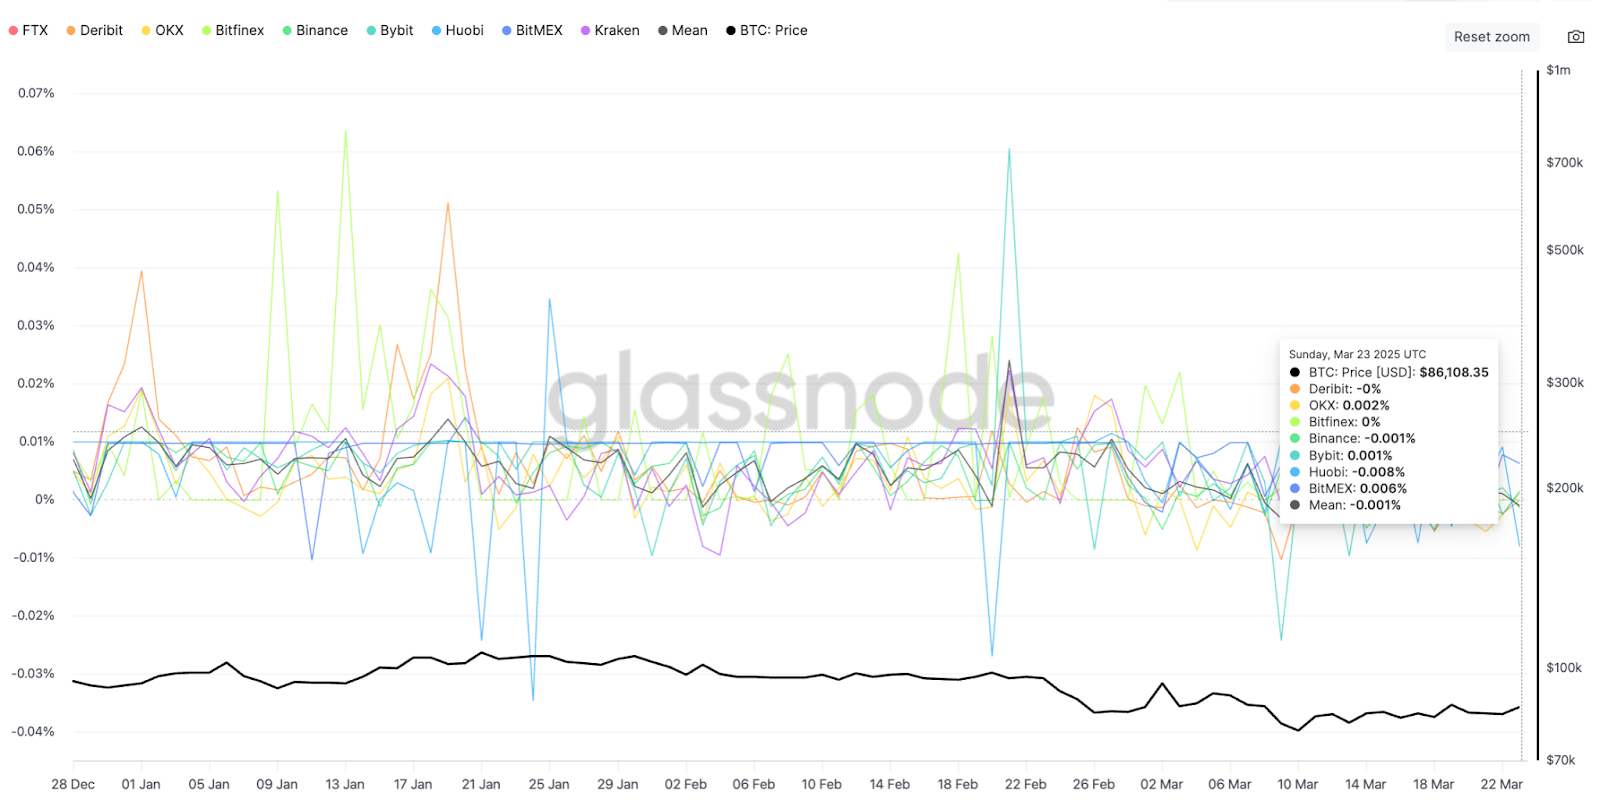
BTC perpetual futures funding rates across all exchanges. Source: Glassnode
-
When funding rates are zero, the cost of holding positions is minimal, reducing pressure on traders to exit longs or shorts.
-
This can stabilize Bitcoin’s price in the short term, as neither side pays a premium, dampening volatility and leading to continued consolidation.
-
This could also signal accumulation before a potential rally, or distribution prior to another leg down.
Trading firm QCP Capital said in a Telegram note to investors that although Bitcoin staged a “modest rebound over the weekend,” breaking back above $85,000, “funding rates remain flat,” adding:
“We remain cautious on prospects for a sustained breakout higher.”
Bitcoin price consolidation is ending — Bollinger Bands
Anticipation of a breakout in BTC price is building, as suggested by Bitcoin’s volatility indicator.
Key points:
-
Tightening Bollinger Bands conditions indicate that a breakout might be very close.
-
The weekly Bollinger Bandwidth is at an extremely oversold level, touching its lower green line.
-
The width of the Bollinger Bands is as tight as it was between July 2024 and October 2024 when it consolidated between $63,000 and $69,000, the 2021 all-time high.
-
Thereafter, the BTC/USD pair rallied 60% from $67,500 in October 2026 to its previous 2024 high of $106,000, reached in December 2024.
-
The indicator was also this tight between June 2023 and September 2023, preceding a 176% rally in BTC price from $24,400 to $73,800 on March 14, 2024.
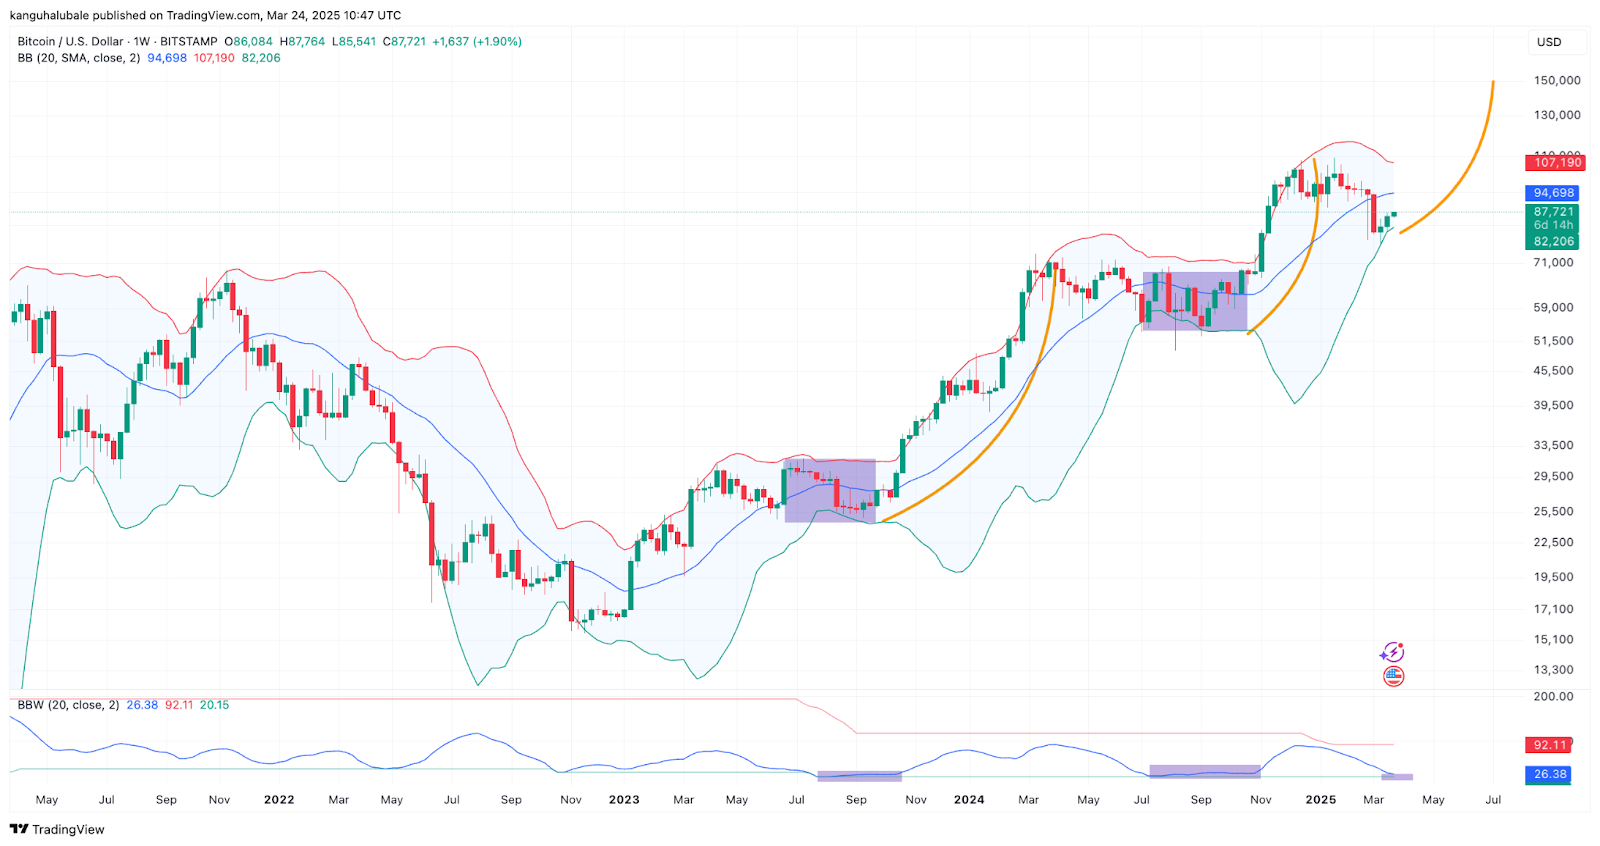
BTC/USD daily chart with Bollinger Bands. Source: Cointelegraph/TradingView
If history repeats itself, Bitcoin could soon break out from the current range over the next few weeks.
This article does not contain investment advice or recommendations. Every investment and trading move involves risk, and readers should conduct their own research when making a decision.
Read the full article here