Este artículo también está disponible en español.
Bitcoin has observed a plunge during the past day. Here’s the nearest on-chain level that the asset would end up retesting if the drawdown elongates.
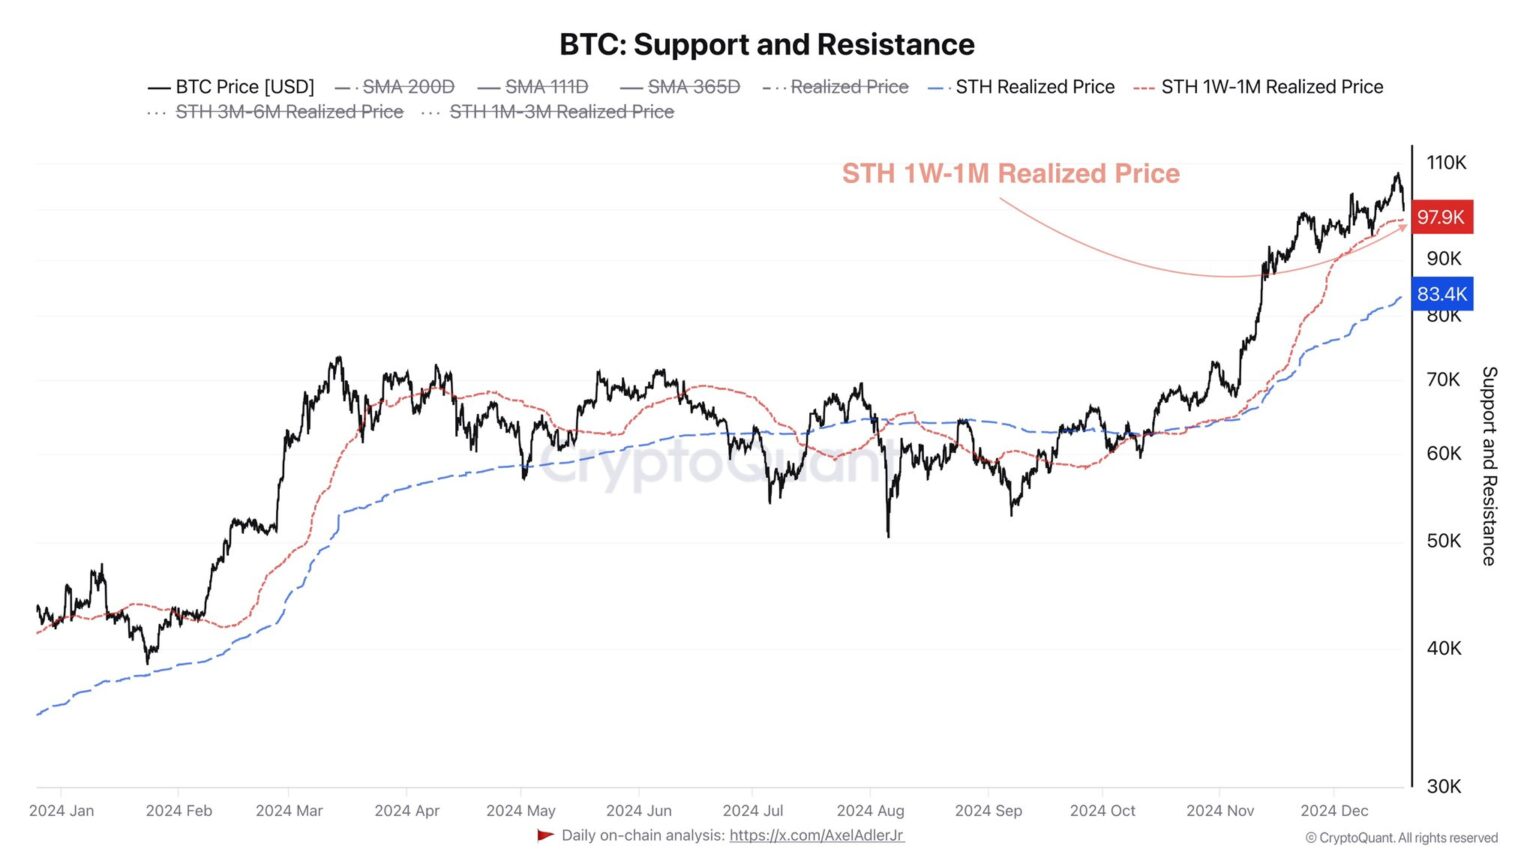
1 Week To 1 Month Bitcoin Holders Have Their Realized Price At $97,900
As pointed out by CryptoQuant author Axel Adler Jr in a new post on X, the Realized Price of the 1-week to 1-month-old BTC investors is the closest support for the asset right now.
Related Reading
The “Realized Price” here refers to an on-chain indicator that, in short, keeps track of the cost basis or acquisition price of the average holder on the Bitcoin network.
When the metric’s value is lower than the spot price of the cryptocurrency, it means the investors as a whole can be considered to be holding a net amount of profit. On the other hand, it being under the BTC value suggests the dominance of loss in the market.
In the context of the current topic, the Realized Price of only a particular segment of the sector is of interest: the 1-week to 1-month-old holders. This cohort includes the addresses that have been holding their coins for at least one week and, at most, one month.
Now, here is the chart shared by the analyst that shows how the Realized Price of this Bitcoin group has changed over the past year:
As displayed in the above graph, the Realized Price of the 1-week to 1-month-old Bitcoin investors has been climbing up alongside the price rally. This is naturally due to the fact that the cohort’s cost basis has been getting repriced to higher levels as new investors have been purchasing at the rally highs.
Currently, the indicator’s value sits at $97,900, so these investors would be in profit at the current price. Earlier in the past day, however, the asset came dangerously close to retesting the level as its price saw a brief dip below $99,000.
The 1 week to 1 month old investors make up a section of a larger cohort known as the short-term holders (STHs). The STHs are broadly defined as the holders who bought their coins within the past 155 days.
Statistically, the longer an investor holds onto their coins, the less likely they become to sell. So, the STHs, and especially the 1-week to 1-month-old segment, would contain the holders with the least amount of resolve in the sector, owing to their low holding time.
Because of how fickle they are, the STHs generally show some kind of reaction whenever their average cost basis gets retested by the Bitcoin price. This reaction may come in the form of buying when the retest occurs from above, as these holders could believe the decline to be just a ‘dip.’
As such, the Realized Price of the 1-week to 1-month-old STHs, which is below the current price, could be looked at as a support level for the cryptocurrency. The level has also already helped the asset out once this month.
Related Reading
So far, Bitcoin has been making a recovery from the plummet, but should the bearish momentum return, the retest of the line may be to watch for, considering the past pattern.
BTC Price
At the time of writing, Bitcoin is trading at around $102,200, down almost 3% in the last 24 hours.
Featured image from Dall-E, CryptoQuant.com, chart from TradingView.com
Read the full article here

