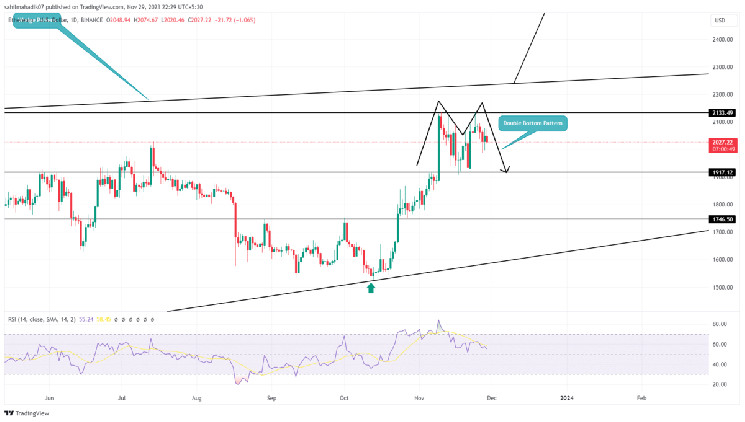
Ethereum Price Prediction: Throughout the major part of November, the Ethereum price remained within a sideways range, fluctuating between $2133 and $1917. Both of these horizontal levels were tested twice, signaling uncertainty among market participants. However, this consolidation has formed a bearish reversal pattern, suggesting a potential further downside for ETH.
Also Read: Here’s Why CBDCs Could Outshine BTC, Ethereum, and Other Private Cryptos
Will $ETH Consolidation Lead to Massive Leap?
- The overhead supply at $2133 assists sellers in developing a bearish reversal pattern called double bottom
- The $1917 level aligned with the 32.8% Fibonacci retracement level creates a strong support zone.
- The intraday trading volume in Ether is $10.5 Billion, indicating a 16% gain.
Ethereum Price Prediction | TradingView Chart
Amid the past two weeks’ consolidation, the Ethereum price retreated twice from the $2133 resistance, indicating substantial overhead supply. These reversals have emphasized the emergence of a bullish reversal pattern known as a Double Bottom on the daily timeframe chart.
Typically observed near market tops, this pattern signifies a decline in bullish momentum. At present, ETH trades at $2,025 and, with an intraday loss of 1.6%, is gradually approaching the neckline support at $1,970.
A bearish breakdown below this neckline could intensify supply pressure, potentially causing ETH to drop to around the $1700 mark, marking a potential loss of 12%.
However, the recent price rejections around the psychological support of $2,000 suggest buyers are attempting to counter the bearish setup. If this buying pressure persists, the ETH price might rebound to challenge the last swing high at $2133 and the upper trendline of a longstanding wedge pattern.
ETH Price Recovery to $3400
Over the past 20 months, the ETH price has experienced a shallow recovery within a rising wedge pattern. Historically, the upper boundary of this trendline has resulted in increased supply pressure, leading to significant corrections. Therefore, the current upward movement towards this upper trendline necessitates a definitive breakout to confirm a bullish trend. A post-breakout rally could potentially drive prices up to $3400
- Relative Strength Index (RSI): A sharp drop in the daily RSI slope suggests a bearish divergence with the Ethereum price, hinting at potential upcoming downturns.
- Bollinger Bands: The converging boundaries of the Bollinger Bands indicate an uncertain market sentiment prevailing for Ethereum.
Read the full article here

