
Ethereum hovered near $1,850 on Binance’s 4 hour ETHUSD chart after recent swings tightened into a narrowing triangle, while an analyst flagged $1,896 as the key level that still keeps the upside setup intact.
$ETH chart pins momentum on $1,896 as triangle tightens
X user Man of Bitcoin said Ethereum needs to hold $1,896 to keep upward momentum alive. He added that a break below that level would shift focus to his “yellow roadmap,” which outlines lower downside targets.
Ethereum/U.S. Dollar 4 hour chart (ETHUSD, Binance). Source: Man of Bitcoin on X
On the chart, price action compresses between a falling upper trendline and a rising lower trendline, forming a triangle that often forces a decision as the range narrows. Ethereum traded around $1,950 while sitting just above the highlighted $1,896 line, which acts as a nearby pivot.
The same roadmap marks upside reference levels near $2,145 and $2,396 if buyers regain control. However, if price slips under $1,896, the chart highlights lower Fibonacci areas around $1,832 and $1,820, with deeper levels near $1,600 and $1,387 also shown as potential downside zones.
Weekly RSI hits rare low as Ethereum revisits long range support
Meanwhile, X user Investing DeCrypted said Ethereum’s weekly RSI dropped to one of its lowest readings on record, marking only the fifth such instance. On the chart, similar RSI lows appeared near prior cycle troughs and later aligned with short-term rebounds. The indicator now sits near the lower band of its long-term range, which frames the current move as another period of compressed momentum.
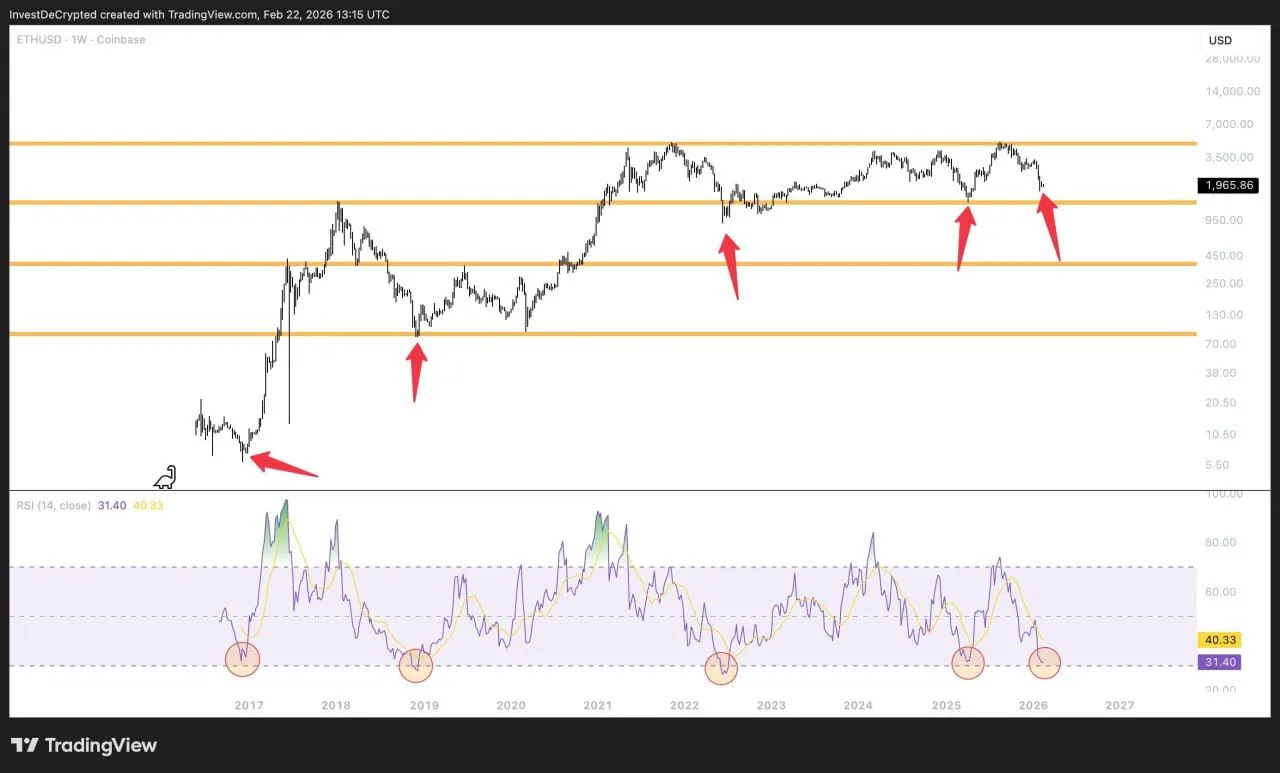
Ethereum/U.S. Dollar weekly chart (ETHUSD, Coinbase). Source: Investing DeCrypted on X
Price action since late 2021 has stayed inside a broad horizontal structure. The chart shows repeated reactions around the same mid-range band, with pullbacks finding bids near prior support and rallies stalling below the upper range. Most recently, Ethereum rolled over from a local high and returned toward the middle of that long-term range, which the analyst marked as a recurring reaction zone across 2022, 2023, 2024, and early 2026.
The weekly view also shows that rallies over the past two years failed to transition into a sustained trend. Instead, price rotated within the range while momentum oscillated between neutral and weak readings. As Ethereum revisits the same support area highlighted by earlier reactions, the RSI again sits near prior cycle lows, placing current price action within a historical context of past compression phases that preceded temporary rebounds on the weekly timeframe.
Read the full article here