The world’s second-largest cryptocurrency Ether (ETH) is showing strong moves with its price regaining $2,1000 levels once again. The bullishness comes as the US SEC opens up discussions for the spot Ethereum ETF approval.
At press time, ETH price is trading 2.9% up at a price of $2,099 with a market cap of $252 billion.
Ethereum Price Can Rally to $3,500
Crypto analyst Michael van de Poppe has expressed his bullishness for Ethereum over the Fidelity filing. In light of this filing, he asserts his belief that following Bitcoin’s surge, Ethereum is poised to reach $3,500 in the first quarter of 2024. As reported by CoinGape, Ethereum also holds the probability to hit a new all-time high in 2024.
#Ethereum Spot ETF filing by Fidelity!
Confirms my thesis that after #Bitcoin gets its shine, we’ll see Ethereum running to $3,500 in Q1 2024.
— Michaël van de Poppe (@CryptoMichNL) November 30, 2023
As reported last week, the Ethereum whale accumulation has been going on pretty strongly. Additionally, on-chain data shows the major exchange of wallet holdings. According to Santiment, the largest Ethereum wallets are exhibiting a positive pattern, indicating a significant shift.
Exchange wallets have dropped to their lowest in the past six months, standing at 8.03 million ETH, while non-exchange wallets have surged to an all-time high of 41.03 million ETH. This trend suggests a growing preference for self-custody, as more coins are transitioning away from exchanges.
Courtesy: Santiment
ETH Price Volatility and Action Ahead
In November, ETH’s price surged by 13%, outpacing Bitcoin’s 8%. A significant factor contributing to Ethereum’s growth was Blackrock’s official filing for a spot ETH ETF (Ethereum-based Exchange Traded Fund).
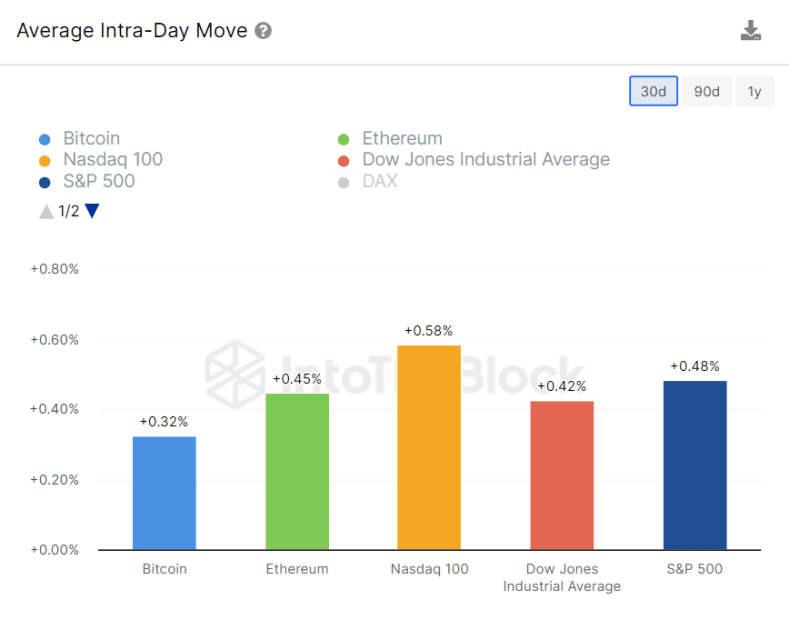
Nevertheless, with the diminishing media hype around ETFs, on-chain data reveals that Ethereum’s price volatility has surpassed that of Bitcoin. This trend might entice swing traders and short-term day traders to allocate more investments in ETH than BTC in December as well.
As per IntoTheBlock, ETH’s 30-day Average Intra-Day Volatility has currently exceeded that of Bitcoin. The provided chart illustrates Ethereum’s Average Volatility score at 0.45%, surpassing Bitcoin’s score of 0.32%.

During a significant portion of November, the Ethereum price experienced lateral movement, oscillating between $2133 and $1917. Repeated testing of these horizontal levels twice each indicated a sense of uncertainty among market participants.
During the recent two weeks of consolidation, the Ethereum price faced two setbacks from the $2133 resistance, revealing considerable overhead supply. These reversals have underscored the formation of a bullish reversal pattern recognized as a Double Bottom on the daily timeframe chart. The question remains whether the ETH price will hit $3,000 before the end of 2023.
Read the full article here

