Reason to trust
Strict editorial policy that focuses on accuracy, relevance, and impartiality
Created by industry experts and meticulously reviewed
The highest standards in reporting and publishing
Strict editorial policy that focuses on accuracy, relevance, and impartiality
Morbi pretium leo et nisl aliquam mollis. Quisque arcu lorem, ultricies quis pellentesque nec, ullamcorper eu odio.
Este artículo también está disponible en español.
The Dogecoin price is once again at are critical point after retesting the mutli-year trendline. However, according to two chartists the popular meme‐inspired token could be on the verge of a major breakout. Crypto Balo (@btcbalo) and Cas Abbé (@cas_abbe) both shared technical charts suggesting a new leg up for DOGE, highlighting specific price thresholds, Fibonacci retracement levels, and a recently confirmed bullish pattern.
Dogecoin Never Below $0,15 Again?
On the three‐day DOGE/USDT chart published by Balo, Elliott Wave markers (labeled (1) through (5) and A‐B‐C) indicate that the market completed a corrective phase near the $0.15 region. This conclusion rests on a cluster of technical signals, including a strong support zone and visible convergence in trading volume. According to Balo, the final wave of the broader correction appears to have ended in the low‐mid teens, which he believes has solidified into a key inflection point.
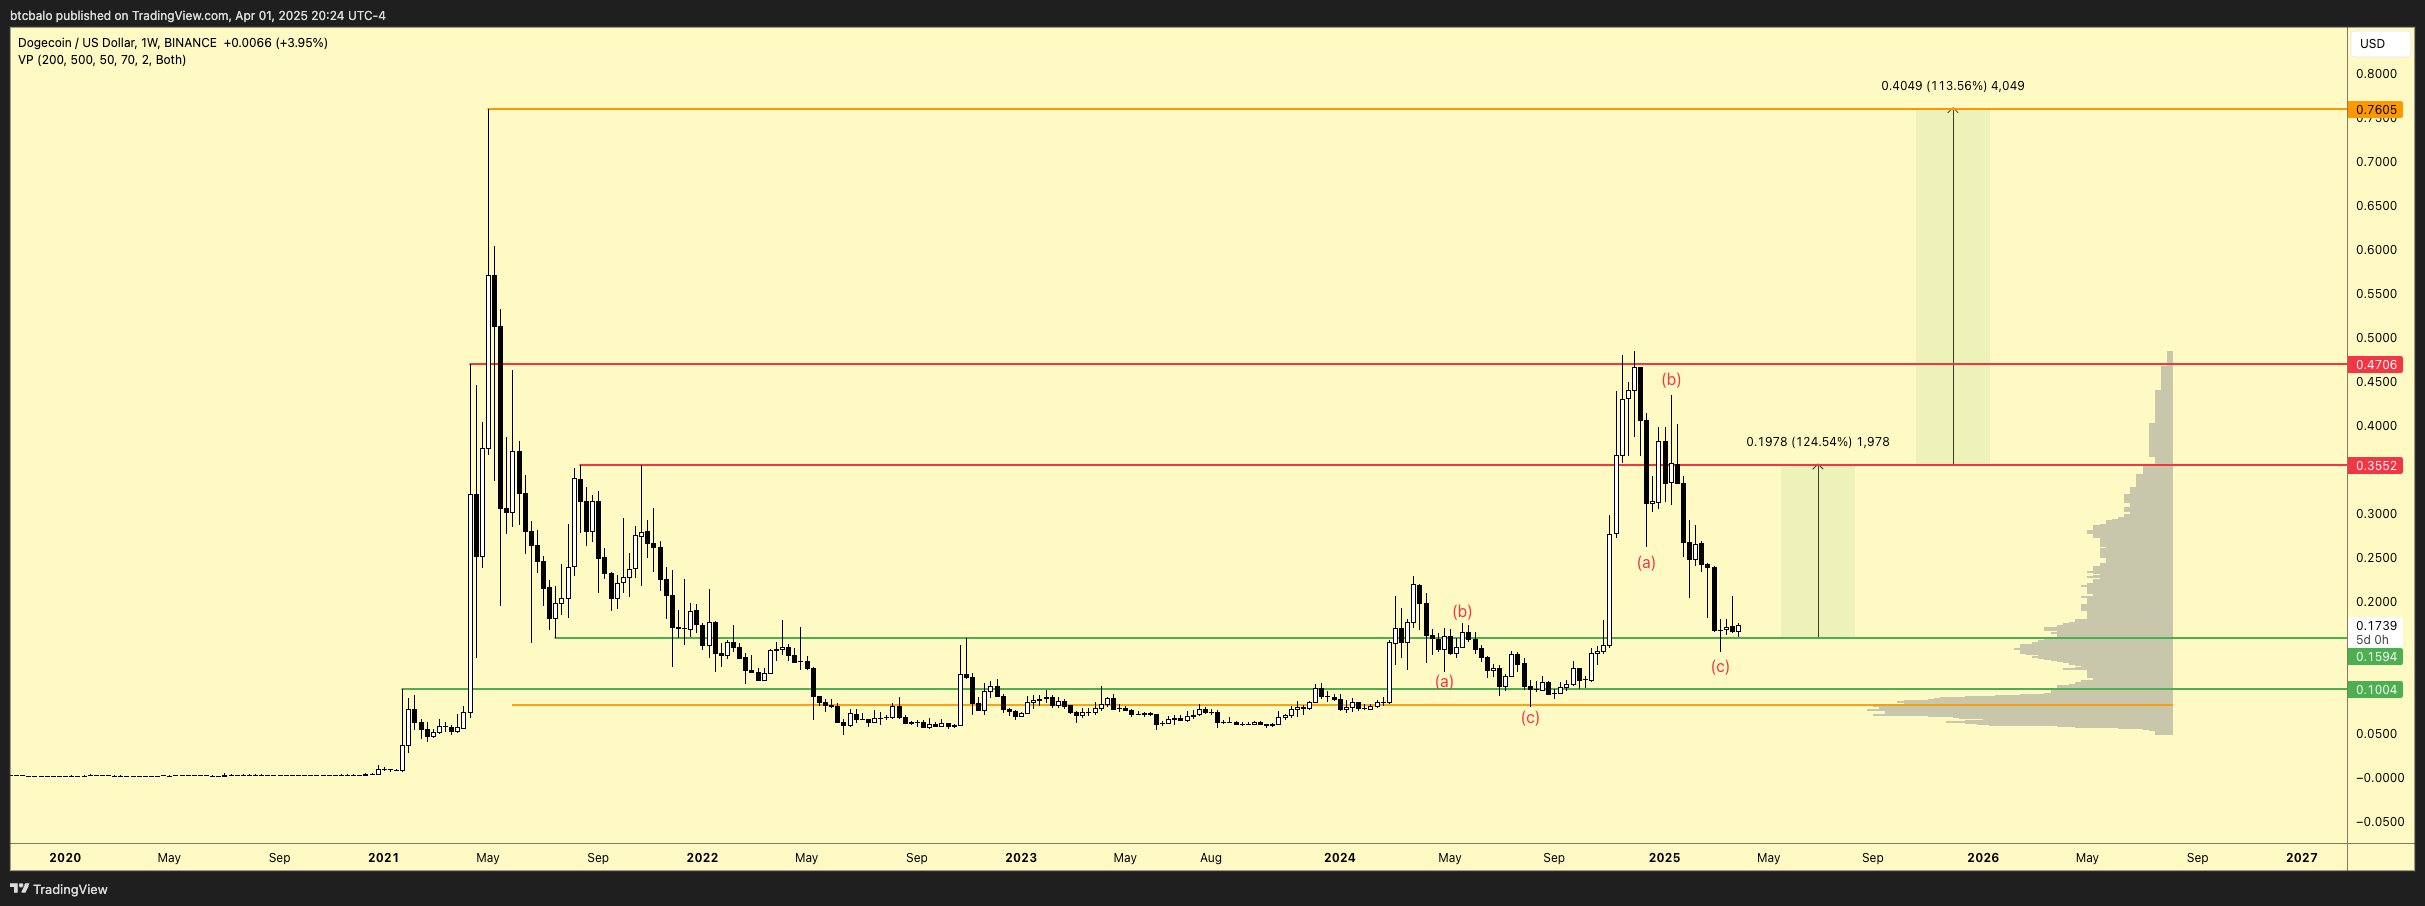
Balo draws special attention to several Fibonacci levels on his chart. He notes that $0.2350 aligns with the 0.618 Fibonacci retracement, while $0.1671 marks the critical 0.786 retracement. In his view, a sustained price above the 0.786 retracement is essential for maintaining Dogecoin’s bullish momentum. Balo further references the 1.0 retracement at $0.0805, labeling it as a major cycle low from previous years but emphasizing that DOGE has not revisited that level for a considerable period.
Related Reading
Based on these observed price structures, Balo anticipates that Dogecoin could move sideways for a brief period to gather momentum. He underscores a likely doubling in price before DOGE encounters its “next major resistance” near $0.3552–$0.36. In his words, “DOGE looks like a bottom to me. Could go sideways for a bit to build momentum but we should be good for a 2x from here before the next major resistance. Once we reclaim $0.36 we can start talking about new ATHs again.”
Related Reading
Thus, he identifies $0.36 as the inflection point that could pave the way to reclaiming historic highs above $0.76, but stresses that he wants to see a decisive break above this resistance first. Until then, he sees $0.15 as a robust support floor and maintains confidence that DOGE’s price action may mimic its bullish structure from September 2024.
DOGE’s Falling Wedge Breakout
Cas Abbé’s shorter‐term analysis, plotted on a four‐hour chart, points to a classical falling wedge formation. Following a decisive move beyond the wedge’s upper trendline, Abbé suggests that buyers have taken the initiative to reverse the prior downtrend.
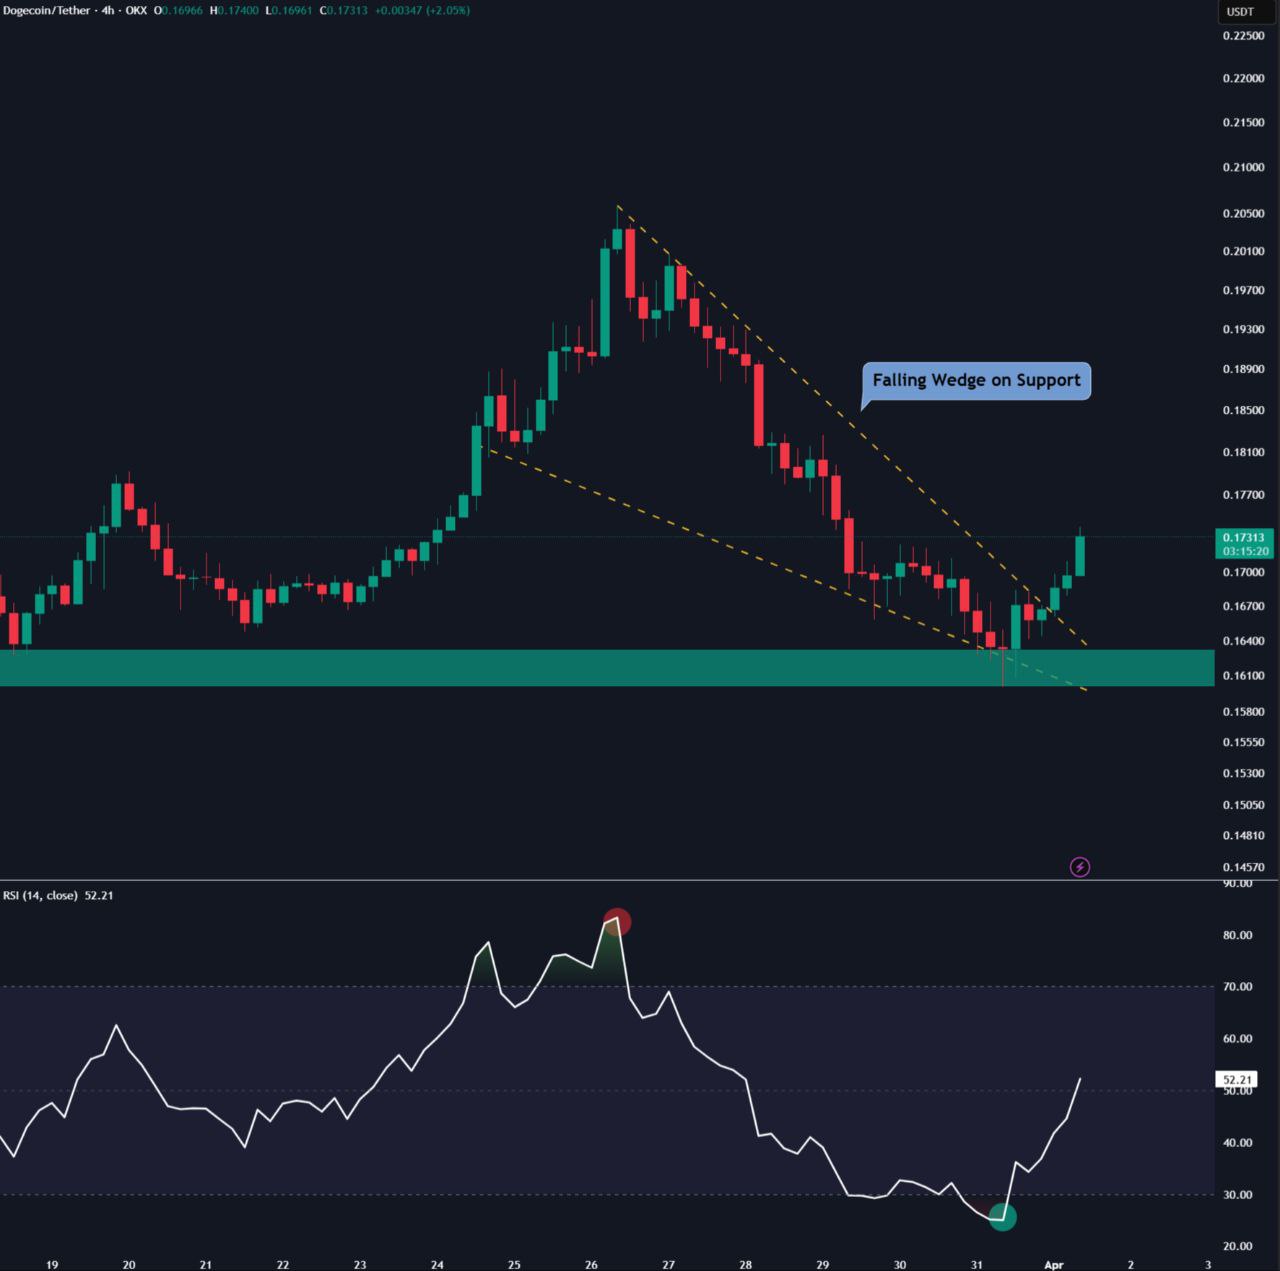
A key factor in Abbé’s assessment is the Relative Strength Index (RSI). He notes that the RSI dipped briefly into oversold territory—an occurrence often regarded as a reliable indicator that selling pressure has reached an extreme. Since then, the RSI has rebounded into the low‐50s range, signaling the possibility of renewed bullish momentum. Citing these technical developments, Abbé comments, “DOGE falling wedge breakout. 4H RSI entered the oversold zone which is an obvious bottom signal. If BTC doesn’t lose its momentum, DOGE could rally towards $0.22–$0.25 in the coming weeks.”
At press time, DOGE traded at $0.17.
Featured image created with DALL.E, chart from TradingView.com
Read the full article here