


BONK is currently facing turbulent waters as a sharp decline casts a shadow over its recent price performance. After a period of impressive gains, the recent downturn is raising concerns about an impending correction, with mounting selling pressure suggesting that the bullish momentum may be waning. As the market sentiment shifts, the crypto community is left wondering how low BONK could go and whether it can regain its footing.
With uncertainty in the air, this analysis aims to analyze the recent sharp decline of BONK and explore the implications for its future price action. By examining key technical indicators, market sentiment, and trading patterns, we aim to assess the likelihood of an impending correction. This piece will provide insights into potential support levels and resistance points, enabling traders and investors to make informed decisions in the face of uncertainty.
Recent Performance: Analyzing The Decline
Recently, BONK’s price has turned bearish on the 4-hour chart, retracing toward the 100-day Simple Moving Average (SMA) and moving above the $0.00001792 support level. The drop from the overbought zone may signal that traders are taking profits or that buying enthusiasm is diminishing resulting in the pullback.
An analysis of the 4-hour Relative Strength Index (RSI) reveals that the signal line has decreased to 66%, retreating from the overbought territory. This decline suggests a shift in market momentum, indicating that buying pressure is beginning to wane. A retreat from the overbought zone often signals that the market may be experiencing a correction, as traders who bought during the bullish run might start to take profits.
Furthermore, on the daily chart, BONK is exhibiting negative momentum, as evidenced by the formation of a bearish candlestick, even while trading above the 100-day SMA. This situation reveals a possible contradiction in market sentiment. Should selling pressure continue and BONK is unable to maintain its position above the 100-day SMA, it may lead to a more significant price correction.
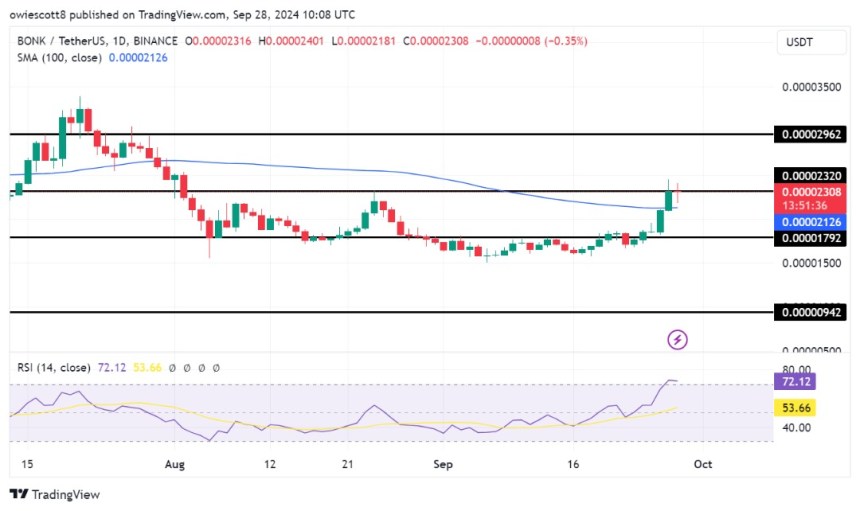

Finally, on the 1-day chart, the RSI has climbed above 50% and currently sitting at 73%, reflecting strong optimistic sentiment and buying pressure. Although this points to more price gains, the closeness to the overbought zone increases the chance of a reversal if buying slows down.
Predictions For The Price Trajectory Of BONK
With technical indicators suggesting an impending pullback, BONK may face a decline in price toward the $0.00001792 level. If this support is breached, it could open the door to further losses, potentially pushing the price down to $0.00000942 and other lower ranges.
However, if the bulls manage to mount a comeback and push the price above $0.00002320, the meme coin could continue its upward momentum toward the next resistance level at $0.00002962. A successful breach of this level may trigger additional gains, allowing the price to challenge other resistance levels above.
Read the full article here


 Soars to 7-Week Peak, Bitcoin (BTC) Calms Below $66K: Weekend Watch")

")