The Bitcoin (BTC) price movement was bullish at the start of November, but the rally has stalled since November 9, leading to consolidation.
These four crypto traders employed different means to give Bitcoin predictions for October, achieving considerable profits.
Long-Term Range Leads to Rejection
Cryptocurrency analysts and traders often use horizontal ranges to determine pivotal levels where the price can bounce or get rejected.
In the case of Bitcoin, one such critical resistance has been at $37,500. The area has intermittently acted as resistance and support since the end of 2020 (green & red icons).
The BTC price reached this area at the beginning of November.
Cryptocurrency trader Crypto Chase noted the importance of this resistance area and suggested that the price will not be able to clear it and reach $40,000. He tweeted that:
Approaching Monthly resistance. Weekly inefficiency fully filled. Entire feed giga bullish, but I can only be cautious here and consider shorts if we see 37.5K+. Not counter-trending bc of sentiment etc. just think it’s a logical place to cool down n print a red weekly.
BTC/USD Weekly Chart. Source: X
IncomeSharks also noted the same horizontal resistance area, stating that a rejection is expected.
While the BTC price has not fallen considerably since the decrease, it has not managed to close above the $37,500 area in the weekly timeframe.
Short-Term Deviation Leads to Increase
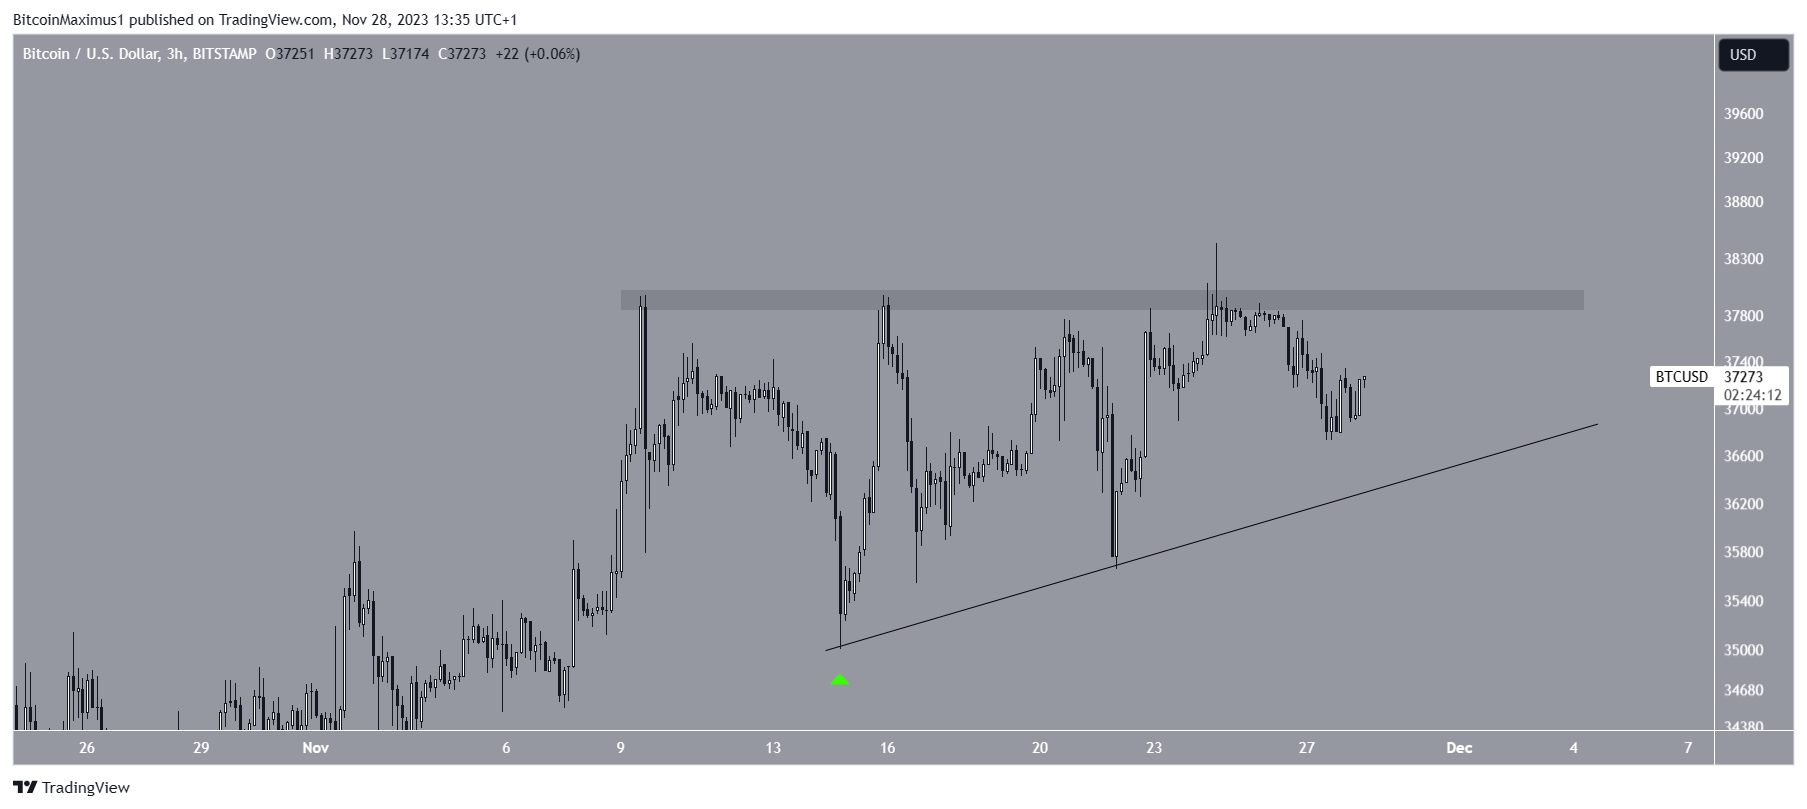
Cryptocurrency trader InmortalCrypto tweeted a short-term chart on November 14. He suggested that the price would deviate below its previous low before moving upward to $37,000.

BTC/USDT 3-Hour Chart. Source: TradingView
The tweet marked the local low until now. Since then, the BTC price has increased alongside an ascending support trend line.
While the price has not broken out from the $38,000 resistance area, it is trading inside an ascending triangle, considered a bullish pattern.
Halving Narrative Gives Accurate BTC Price Prediction
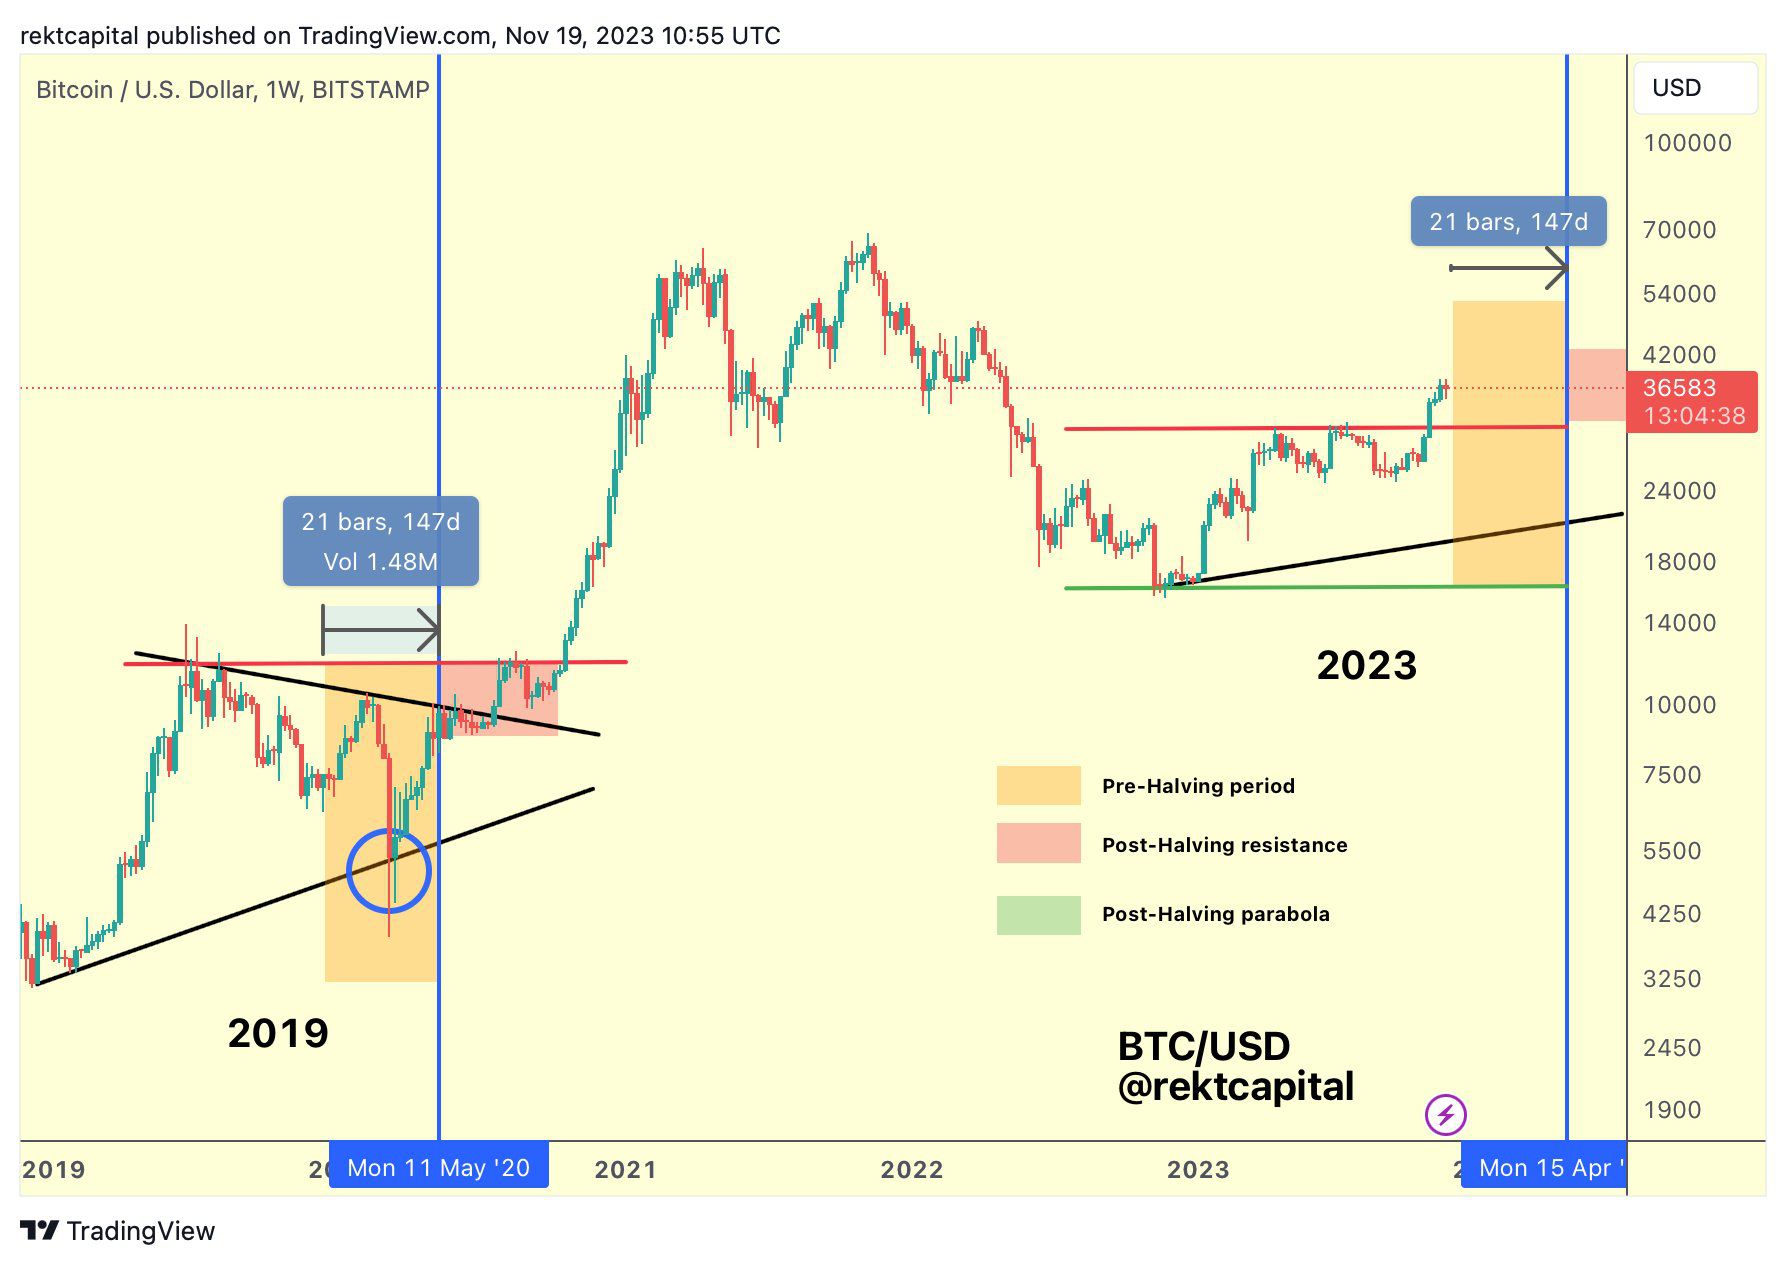
Cryptocurrency trader RektCapital analyzed the BTC price movement before the 2020 halving to predict the movement in 2023 & 2024.
He stated that:
Less than 150 days until the Bitcoin Halving Any deeper retracements over this period will likely generate outsized Return On Investment in the post-Halving period

BTC/USDT Weekly Chart. Source: X
Suppose the same price movement is similar going into the April 2024 halving. In that case, the BTC price will consolidate and possibly decrease until then before going parabolic in the second half of 2024.
It is worth mentioning that the movement in 2023 has been much more bullish than that in 2019, when the price corrected considerably.
For BeInCrypto’s latest crypto market analysis, click here
Read the full article here

