The crypto market has started the new week losing part of the gains accrued in November. Bitcoin price, for instance, is down 1.6% to $36,803 while Ethereum trades 2.5% down on the day at $2,018.
Most altcoins are in the red including the likes of Binance Coin down 2.7%, XRP down 4%, and Solana down 5.2% according to live market data by CoinGecko.
Last week Bitcoin price rallied closing the gap to $38,000 amid renewed optimism regarding the possible approval of Bitcoin spot exchange-traded funds (ETFs) after BlackRock met with the Securities and Exchange Commission (SEC) last week.
Grayscale, the biggest digital asset management company also worked closely with the agency to modify its proposal to convert the Bitcoin Trust (GBTC) product to a spot BTC ETF.
Experts and market participants believe the SEC could approve a bunch of applications within weeks, possibly before year-end. However, nothing is cast in stone because the regulator might still decide to delay its decision one more time.
Recommended for you: Shiba Inu Price Prediction As Burn Rate Surges 442x, $1 SHIB Incoming?
Bitcoin Price Risks Rising Wedge Pattern Breakdown
Bitcoin’s technical outlook has significantly weakened over the past few days, with losses extended from $38,000 to the current market value of $36,833. Failure to break resistance at $38,000 is leaving the largest crypto unstable while investor confidence in the uptrend erodes.
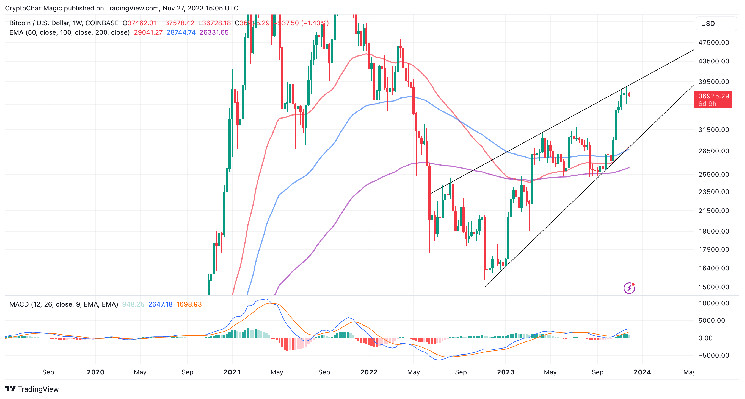
Continued dips below $37,000 are exerting pressure on key support areas at $36,000 and $34,000. It would be premature to rule out possible losses to $33,000 and lower, especially with the formation of a rising wedge pattern on the weekly chart.
Bitcoin price weekly chart | Tradingview
This pattern forms during bullish periods, allowing for consolidation before the price retraces further. It is formed by two climbing trendlines—one connecting a series of higher highs and the other higher lows.
The formation of the rising wedge pattern does not guarantee that declines will materialize because it is only validated when the price slides below the lower trendline support.
That said, overhead pressure must increase to push Bitcoin below $33,000 to validate the pattern. Otherwise, an impelling above the upper trendline resistance would imply a renewed bullish thesis, with Bitcoin able to approach the resistance between $38,000 and $40,000 for gains targeting $50,000 before year-end.
The Moving Average Convergence Divergence (MACD) indicator has a bullish outlook, upholding the buy signal from October 16. In addition, Bitcoin price sits above all three bull market indicators, starting with the 200-week EMA, the 100-week EMA, and the 50-week EMA.
If bulls uphold support at between $35,000 and $36,000, the rally above $38,000 would be a matter of when and not if.
Bitcoin Mid-Term Holders Increase Exposure
Insights from blockchain analytics platform IntoTheBlock shined a light on BTC market cycles based on “the balance by time-held variation” indicator. This specially designed indicator divides Bitcoin holders into three categories: Long-term holders, mid-term holders, and short-term holders.
Using this indicator investors can begin to appreciate how the behavior of each cohort impacts sentiment and the price.
For instance, long-term holders (STH) have slowed their uptake of BTC over the last three months when compared to their activities during the previous 12 months.
However, there is an interesting outlook depicted by mid-term holders whom IntoTheBlock refers to as “cruisers.” This cohort of investors has increased their share of BTC supply, pointing at a more optimistic approach.
Exploring Bitcoin’s Market Dynamics: A Dive into Balance Changes by Time Held
We’ve analyzed a key on-chain indicator for determining market cycles: the balance by time-held variation. It categorizes Bitcoin holders into three groups based on the duration of their holdings. This… pic.twitter.com/Ol0fitnnbn
— IntoTheBlock (@intotheblock) November 27, 2023
Lastly, short-term holders have been slashing their Bitcoin balances, embracing a cautious approach. However, the rate of decrease is slower than the pattern seen in 2022.
“The contrasting trends between long-term accumulation and mid-term holder activity suggest that we’re in a transitioning market phase.”
Long-term holders are likely to have bought Bitcoin below $30,000 and are now profiting with Bitcoin battling resistance at $38,000. Mid-term holders, on the other hand, are seeking exposure amid the optimism of Bitcoin spot ETFs being approved.
Related Articles
- Binance Embraces Regulatory Collaboration Under CEO Richard Teng
- Why Is Luna Classic (LUNC) Price Skyrocketing Today?
- Israeli Agencies Unearth Massive Tron Wallets Linked to Militant Financing
Read the full article here

