
Many Bitcoin (BTC) traders became bullish this week as prices rallied deep into the $88,000 level, but failure to overcome this level in the short term could be a take-profit signal.
Alphractal, a crypto analytics platform, noted that Bitcoin whales have entered short positions at the $88,000 level.
In a recent X post, the platform highlighted that the “Whale Position Sentiment” metric exhibited a sharp reversal in the chart, indicating that major players with a bearish bias have stepped. The metric defines the relationship between the aggregated open interest and trades larger than $1 million across multiple exchanges.
Bitcoin: Whale position sentiment. Source: X
As illustrated in the chart, the two circled regions are synonymous with Bitcoin price falling to the $88,000 level. Alphractal said,
“When the Whale Position Sentiment starts to decline, even if the price temporarily rises, it is a strong signal that whales are entering short positions, which may lead to a price drop.”
Alphractal CEO Joao Wedson also confirmed that whales had closed their long positions and that prices have historically moved according to their directional bias.
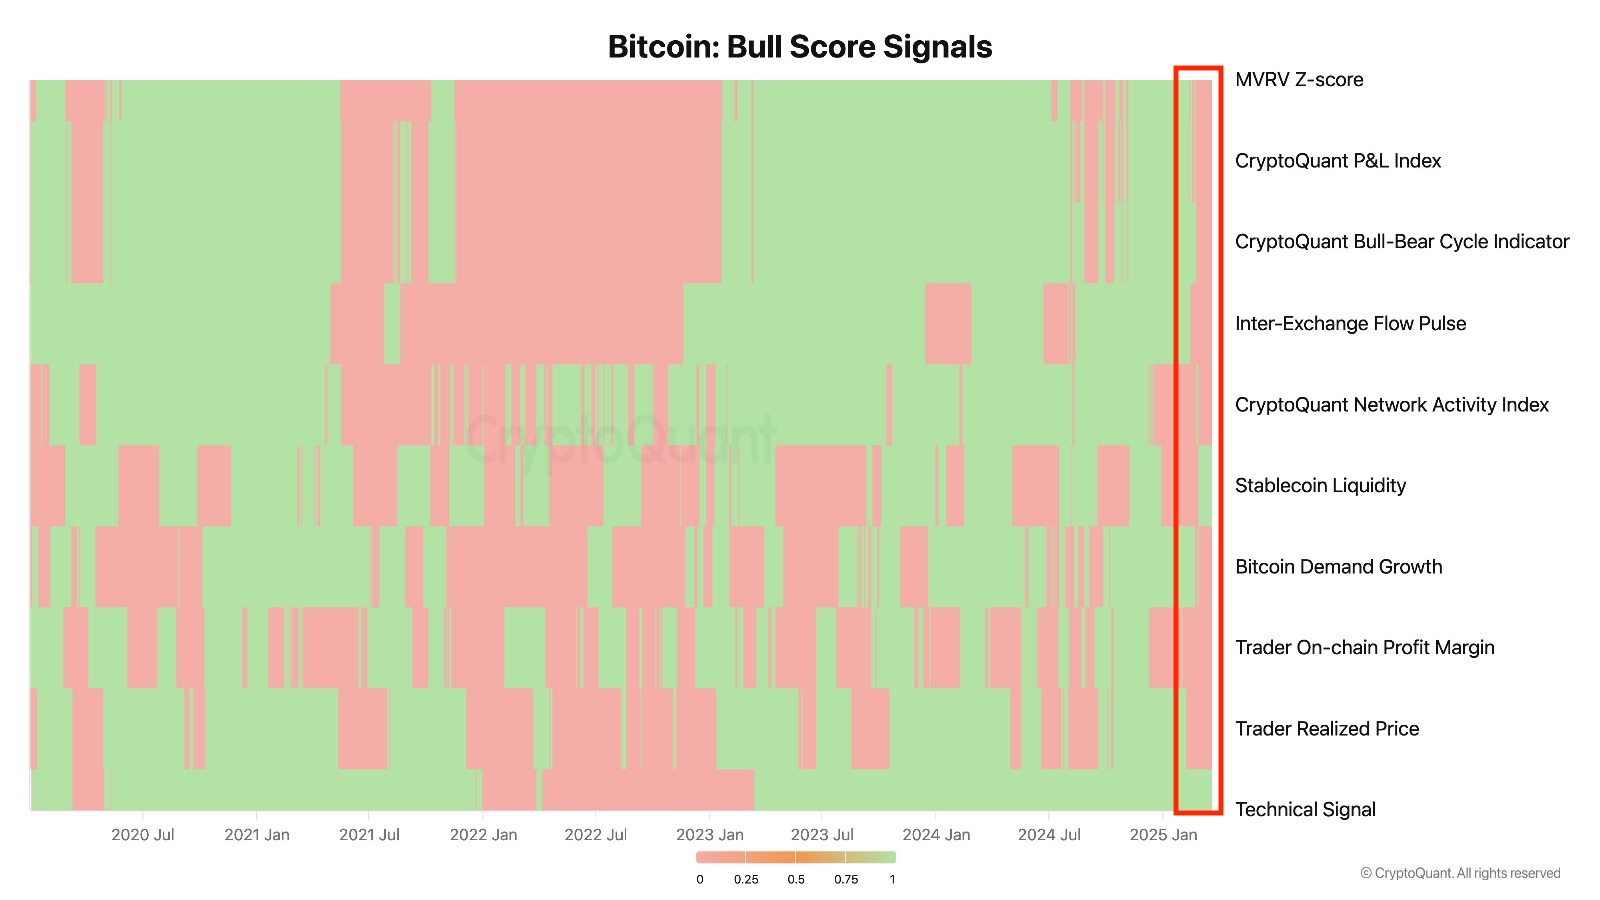
Bitcoin: Bull score signals. Source: CryptoQuant
Similarly, 8 out of 10 onchain signals on CryptoQuant have turned bearish. As highlighted above, with the exception of the stablecoin liquidity and technical signal indicators, all the other metrics flash red, underlining the likelihood of a possible pullback in Bitcoin price.
Last week, Ki Young Ju, CEO of CryptoQuant, noted that the markets were entering a bear market and that investors should expect “6-12 months of bearish or sideways price action.”
Related: Will Bitcoin price hit $130K in 90 days? Yes, says one analyst
Bitcoin outflows reach $424M in 7 days
While onchain metrics turned red, some investors exhibited confidence in Bitcoin. Data from IntoTheBlock highlighted net BTC outflows of $220 million from exchanges over the past 24 hours. The sum reached $424 million between March 18 to March 24. This trend implies that certain holders are accumulating.
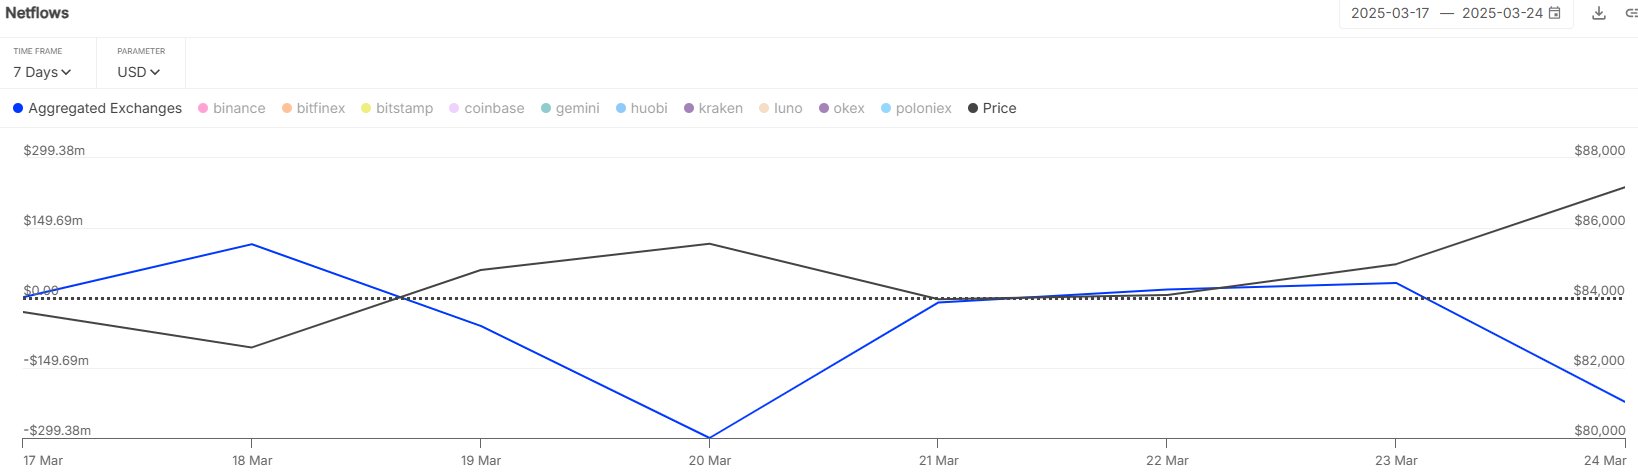
Bitcoin net outflows by IntoTheBlock. Source: X
On the lower time frame (LTF) chart, Bitcoin formed an intraday high at $88,752 on March 24, but since then, BTC has yet to establish a new intraday high.
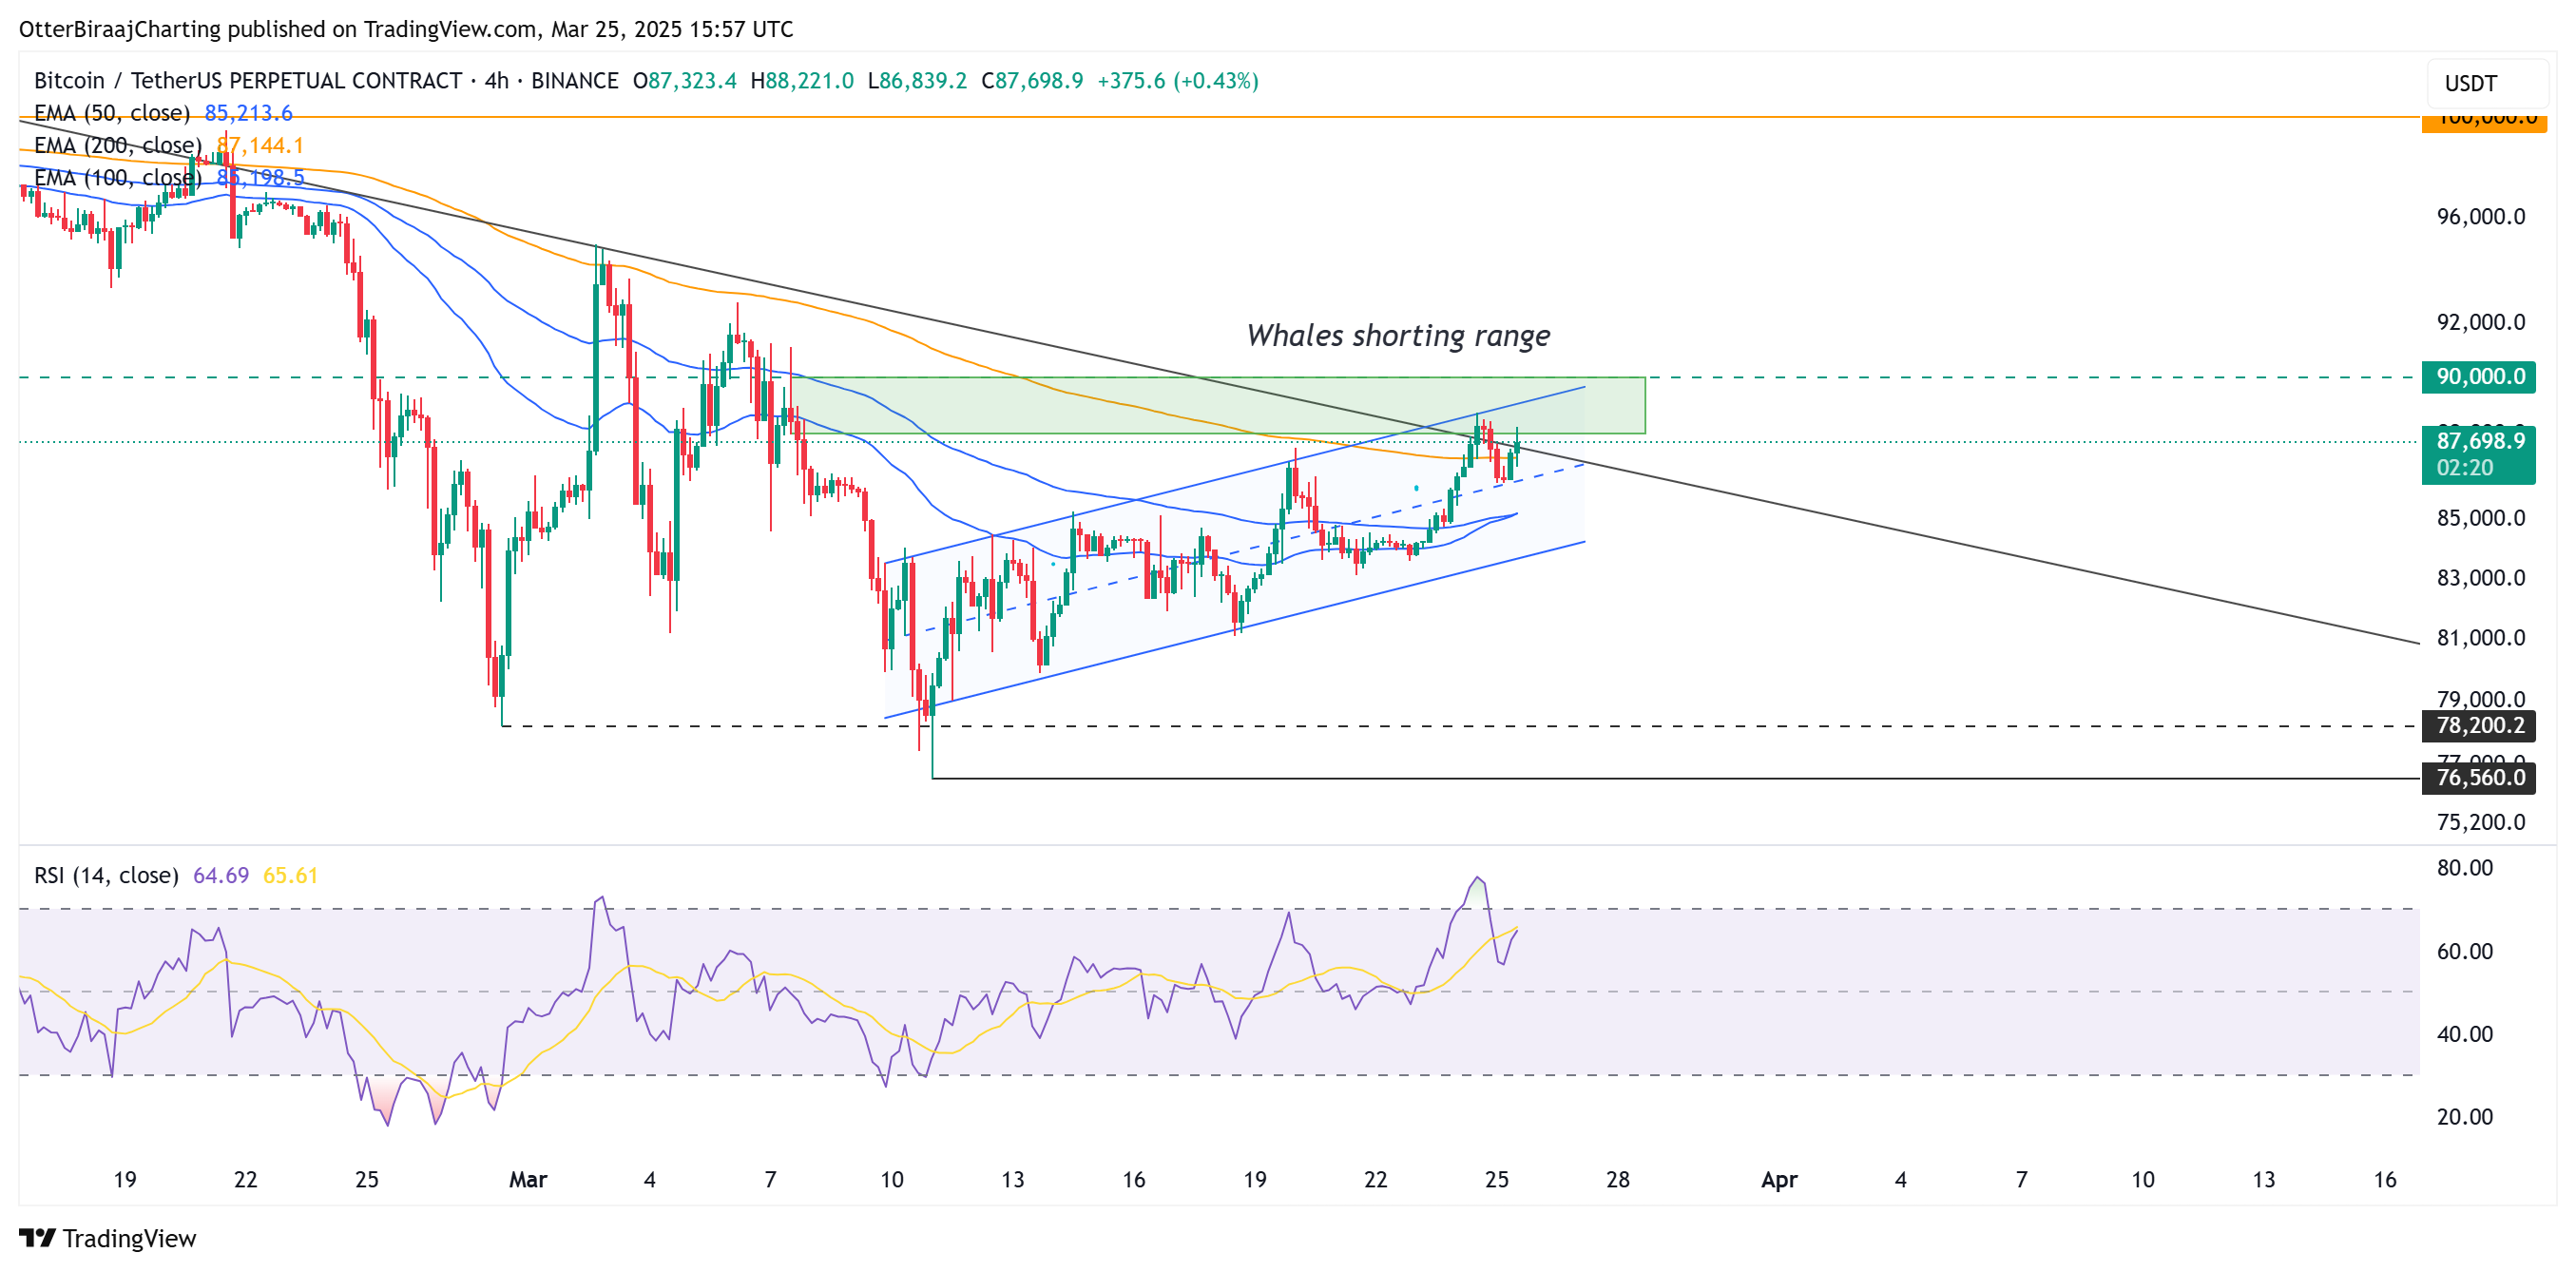
Bitcoin 4-hour chart. Source: Cointelegraph/TradingView
With Bitcoin moving within the trendlines of an ascending channel pattern, it’s expected that the price will face resistance from the upper range of the pattern and 50-day, 100-day, exponential moving averages on the daily chart.
With whales possibly shorting between $88,000 and $90,000, Bitcoin needs to close above $90,000 for a continued rally to $100,000.
Related: Bitcoin sets sights on ‘spoofy’ $90K resistance in new BTC price boost
This article does not contain investment advice or recommendations. Every investment and trading move involves risk, and readers should conduct their own research when making a decision.
Read the full article here