Solana Price Prediction: In 2024, Solana has emerged as a focal point in the cryptocurrency market, grabbing headlines for various reasons—from the meme coin frenzy and recent network outage to a significant increase in its Total Value Locked (TVL). The resurgence of its native token, SOL above a three-digit valuation has turned investor focus toward the potential opportunities this asset presents. Will the renewed recovery in the market bolster SOL for higher growth?
Also Read: Solana Price Prediction: How SOL Could Hit $140 After Breaking $100 Barrier
Will SOL Price Resume On Recovery Trend?
Solana Price Prediction| Tradingview
The Solana coin re-entered the recovery trend in late January when the price rebounded from the $79 mark. This positive turnaround has surged the altcoin 37% within three weeks to currently trade at $108.5.
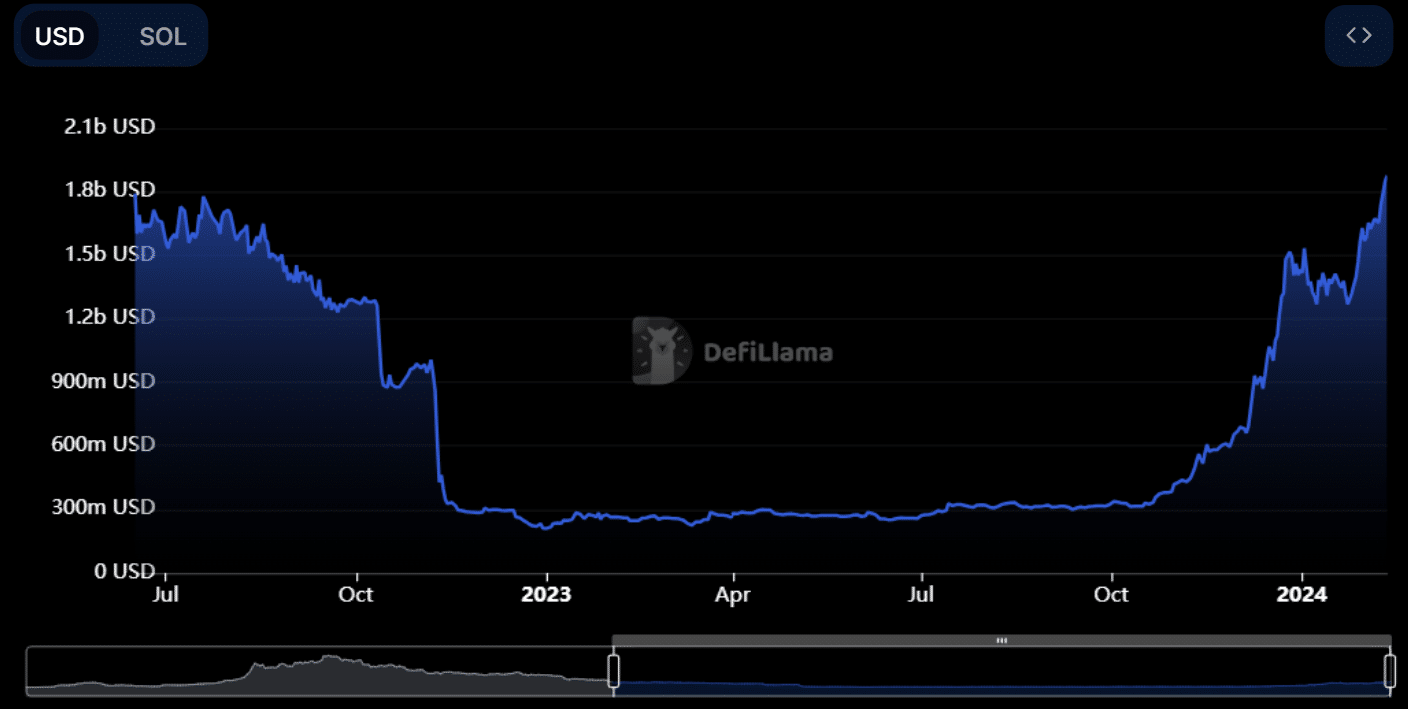
Amid this rally, the network’s TVL(Total Value Locked) also witnessed exponential growth surpassing the $1.85 Billion milestone. The increase in TVL underscores the growing trust and interest in the Solana ecosystem, potentially leading to more significant adoption and investment in the platform.

Solana TVL(Total Value Locked)| DefiLlama
Furthermore, a look at the daily time frame chart shows the formation of an inverted head and shoulder pattern. This bullish reversal pattern is commonly observed at the market bottom, reflecting increased accumulation from investors for a fresh recovery.
On February 9th, the Solana price gave a bullish breakout from the pattern’s neckline resistance at $105. The recent price hike also regained the fast-moving EMAs 20 and 50 indicating the buyers are active in influencing this asset.
With an intraday loss of 0.5%, the coin is likely witnessing a post-breakout rally meant to analyze the price sustainable for higher growth. If the altcoin managed to sustain above this support, the buyers may drive a 24.5% to hit $134.
Also Read: Solana Faces Security Threat as Blowfish Detects Drainer Risk
Technical Indicator
- Bollinger Band: An upswing in the upper boundary of the Bollinger band indicator reflects the recovery momentum is aggressive.
- Average Directional Index: The ADX slope at 13% and rising indicates the buyers hold sufficient momentum for prolonged recovery.
Related Article: Crypto Headlines of The Week: Bitcoin, Solana, & Shiba Inu Fuels Inferences
Read the full article here

