
Pepe Coin Price Prediction: Over the last two months, the frog-themed meme cryptocurrency PEPE has experienced a consistent decline on the daily chart. It fell nearly 50% from a high of $0.00000175 to a low of $0.00000086, significantly impacting investors. However, analysis of the technical charts reveals this downtrend as part of a key reversal pattern, suggesting a potential turnaround and opening up opportunities for buyers to make a comeback.
Also Read: Meme Coin Price Prediction: Future of Meme Coins Analyzed
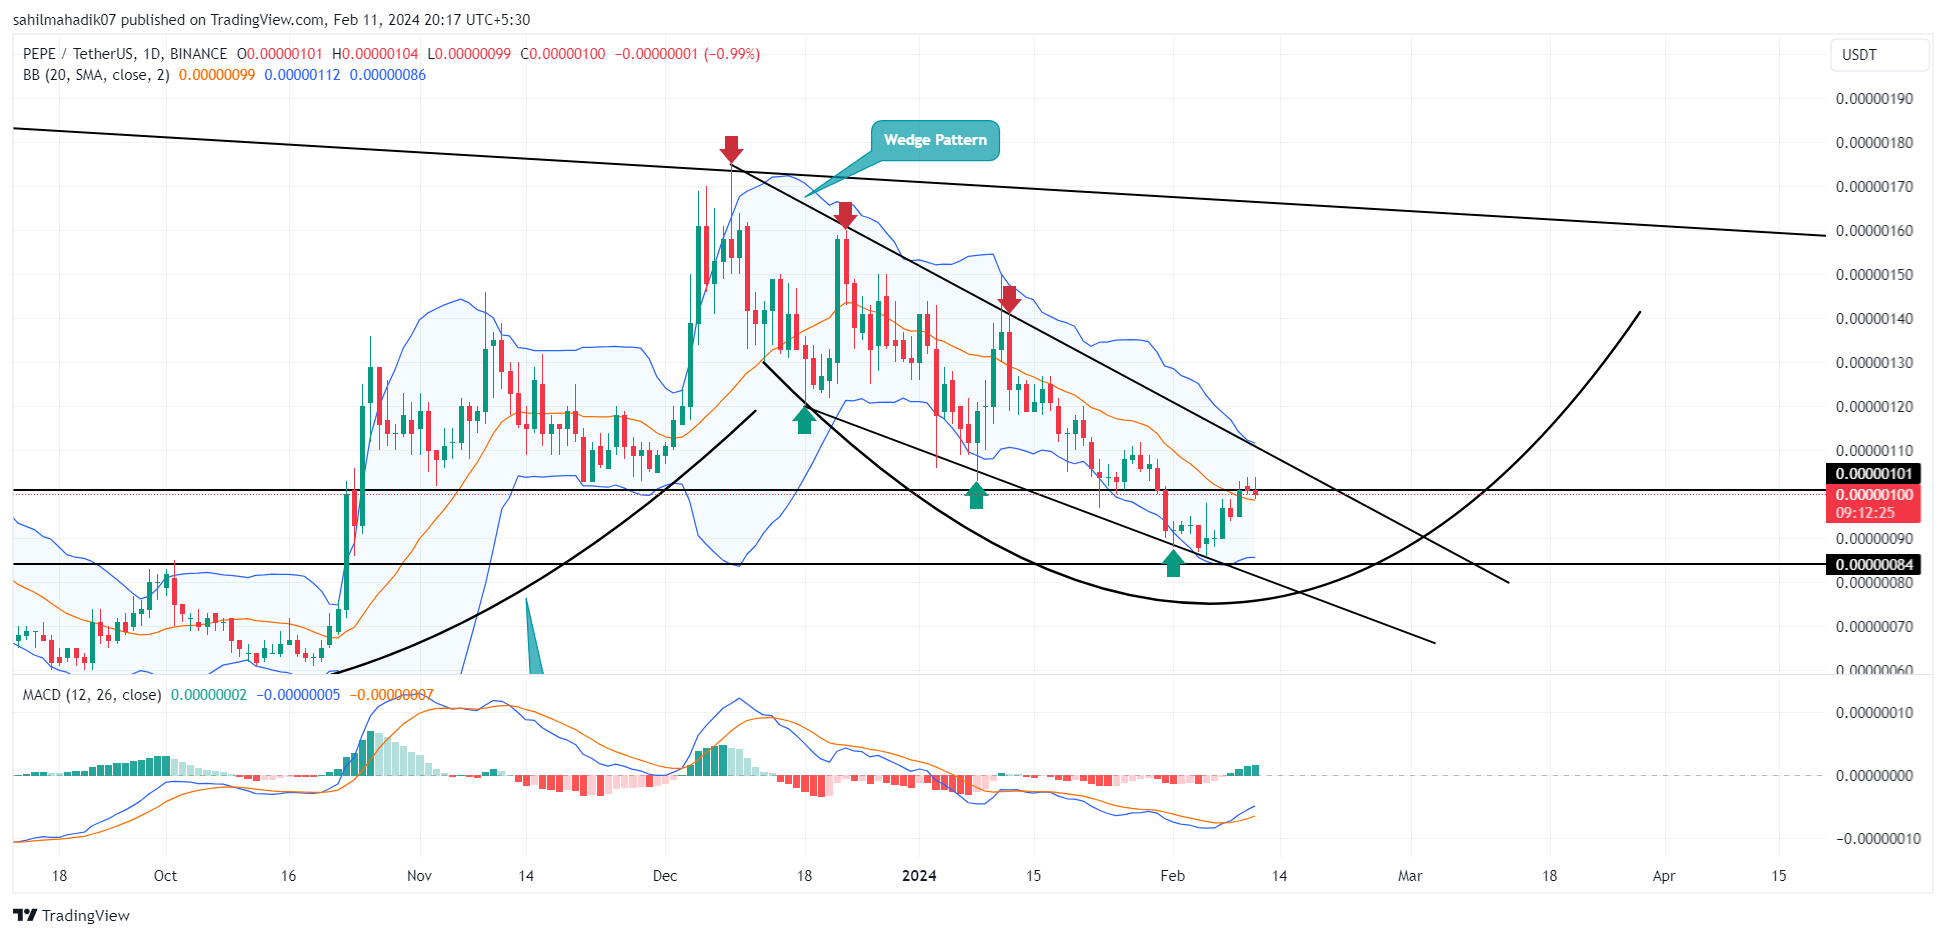
Will PEPE Price Hold the $0.000001 Support?
PEPE Price| Tradingview
According to a recent analysis by @alichart, $PEPE cryptocurrency is showing technical signs of an upcoming bullish trend on its 3-day chart. It’s forming the right shoulder of a head-and-shoulders pattern, and the TD Sequential indicator has issued a buy signal.
This combination of factors suggests a potential upward momentum for $PEPE, making it a point of interest for traders and investors alike. The inverted head and shoulders pattern signals a bullish reversal at a downtrend’s end, featuring three troughs with the central one deepest.
$PEPE is currently showing signs of forming the right shoulder of a head-and-shoulders pattern on its 3-day chart. Additionally, the TD Sequential indicator has issued a buy signal within this timeframe, suggesting an anticipated bullish impulse for #PEPE. pic.twitter.com/brSr7uln3z
— Ali (@ali_charts) February 10, 2024
Amid the renewed recovery in the crypto market, the PEPE price has surged from $0.00000086 to $0.00000102, registering a 16% weekly gain. If the pattern holds true, the Pepe price should rise to the neckline resistance at $0.00000162, resisting a potential gain of 55%.
Also Read: Crypto Prices Today: Bitcoin Crosses $47K, Ethereum At $2.5K, PEPE Recovers As Bonk Leads Rally
When Will PEPE Price Recovery Start?
PEPE Price| Tradingview
In a deeper analysis of the Daily time frame chart, the ongoing correction in Pepe Price is resonating within the two converging trend lines of a falling wedge pattern. In theory, this chart pattern is another setup that hints at the maturity of a correction trend and the potential for higher recovery. Under favorable bullish conditions, the paper price should signal the start of a fresh recovery trend, providing new long-entry opportunities to traders.
Depending on the time of breakout, the PEPE price will need 2-3 weeks before reclaiming the $0.0000014 mark
- Bollinger band: An upswing in the lower boundary of the Bollinger band indicator provides additional support for PEPE buyers at $0.00000084.
- Moving Average Convergence Divergence: A bullish crossover state between the MACD and signal line, reflects an early sign of recovery from buyers.
Read the full article here