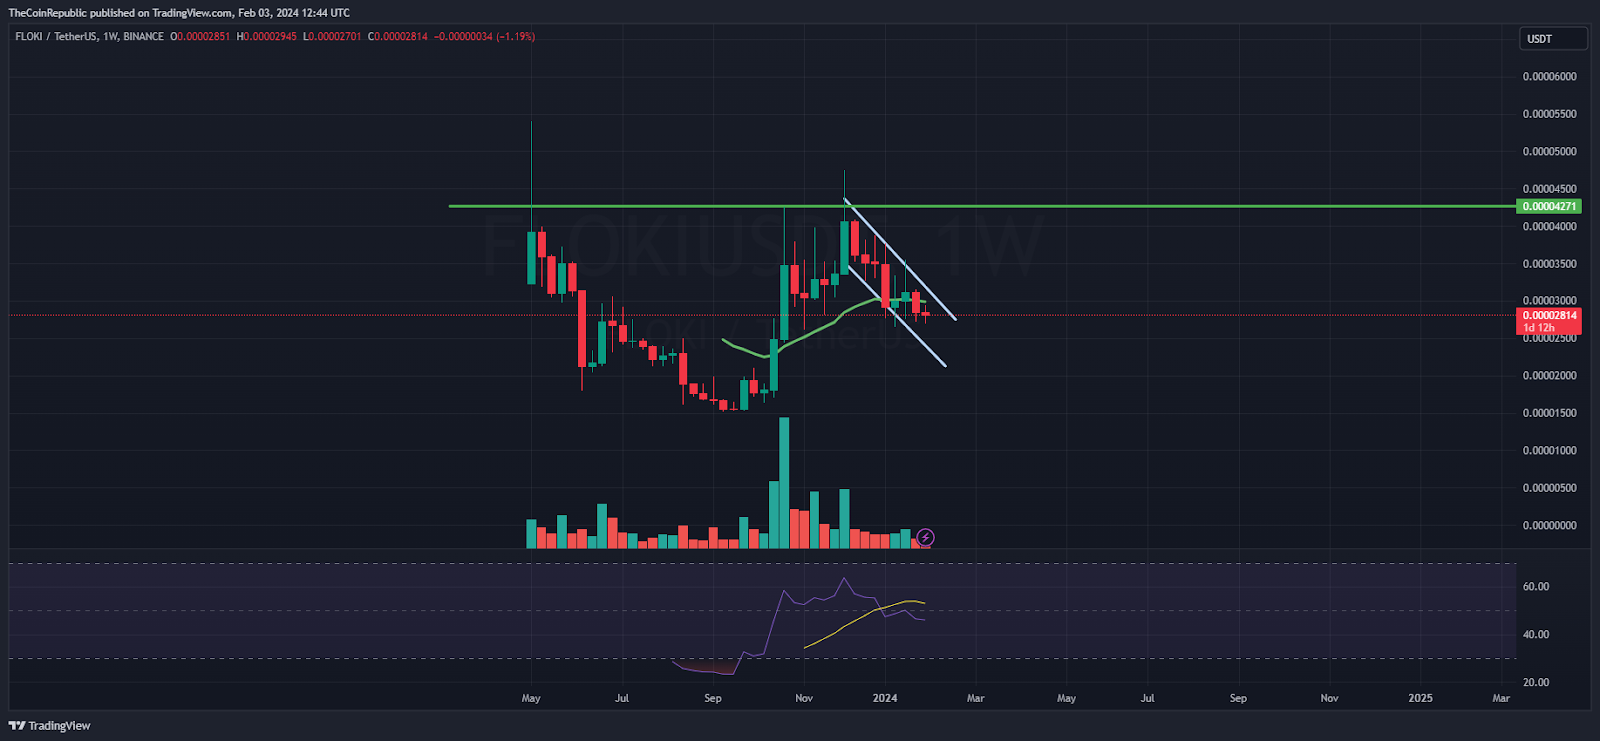
- 1 FLOKI token breached the 200-day EMA mark and is disclosing weakness.
- 2 The Buyers are headed into trouble and are trying to retain strength.
The FLOKI token noted a falling channel pattern and persisted in forming the lower low swings, which signified selling pressure in the past sessions. Moreover, the token has breached the 200-day EMA mark, which is a negative sign for the investors who have held it in their portfolios. Furthermore, the price action indicates low investor interest, and the token hovers below its critical support zone of $0.00003000.
The FLOKI price slipped below the key moving averages and has entered a bearish trajectory revealing a downtrend. The technicals imply the lower low formations and the token may continue to face a selloff in the following sessions. However, the slippage below the 200-day EMA was not intense. A consolidation was witnessed, which suggests that bulls will soon retest it and attain a rebound.
The price of the cryptocurrency was $0.00002802 at press time, with an intraday drop of 0.16%, showing a bearish bias. Moreover, the trading volume remained average, at $5.74 Million, highlighting low investor interest. The pair of LDO/BTC was noted at 0.000000000653 BTC, and the market cap is $279.40 Million. FLOKI has a negative return ratio of -3.54% on weekly basis and -10.73% on monthly basis.
Analysts are bearish and suggest that the FLOKI price will continue to hover below $0.00003000 in the following sessions.
FLOKI On Daily Charts Displays Falling Channel
Source: FLOKI/USD Chart By TradingView
On the daily charts, the FLOKI token slipped from highs of $0.00004750 and lost over 40% of gains in the recent sessions due to adverse market sentiments. The price action signifies the distribution from the top. Sellers are looking aggressive now, and follow-on selling momentum was witnessed.
The RSI curve stays below the midline in the oversold region, signifying bearish bias on the charts. Moreover, the MACD indicator shows a bearish crossover and justifies the bears’ dominance.
FLOKI On Weekly Charts Displays Rejection From The Supply Zone

Source: FLOKI/USD Chart By TradingView
On the weekly charts, the FLOKI crypto price retested the supply zone of $0.00004700 and formed a piercing candle, and follow-on selling pressure was witnessed near the highs. Afterward, the token dragged the gains and slipped below the 20-day EMA mark. The token may continue to decline and will retest the demand zone of $0.00002400 in the following sessions.
Summary
The FLOKI price signifies a trend reversal and faced rejection from the highs, resulting in an erosion of over 40% in the last sessions. Moreover, the token has breached the 200-day EMA mark and replicates bearishness on the charts. Additionally, if the token did not retest $0.00003000, it may extend the decline toward $0.00002500 in the following sessions.
Technical Levels
Support Levels: $0.00002700 and $0.00002500
Resistance Levels: $0.00003000 and $0.00003200
Disclaimer
The views and opinions stated by the author or any other person named in this article are for informational purposes only and do not constitute financial, investment, or other advice. Investing in or trading crypto or stocks comes with a risk of financial loss.
Pratik Chadhokar
Mr. Pratik chadhokar is an Indian Forex, Cryptocurrencies and Financial Market Advisor and analyst with a background in IT and Financial market Strategist. He specialises in market strategies and technical analysis and has spent over a year as a financial markets contributor and observer. He possesses strong technical analytical skills and is well known for his entertaining and informative analysis of the Financial markets.
Read the full article here

