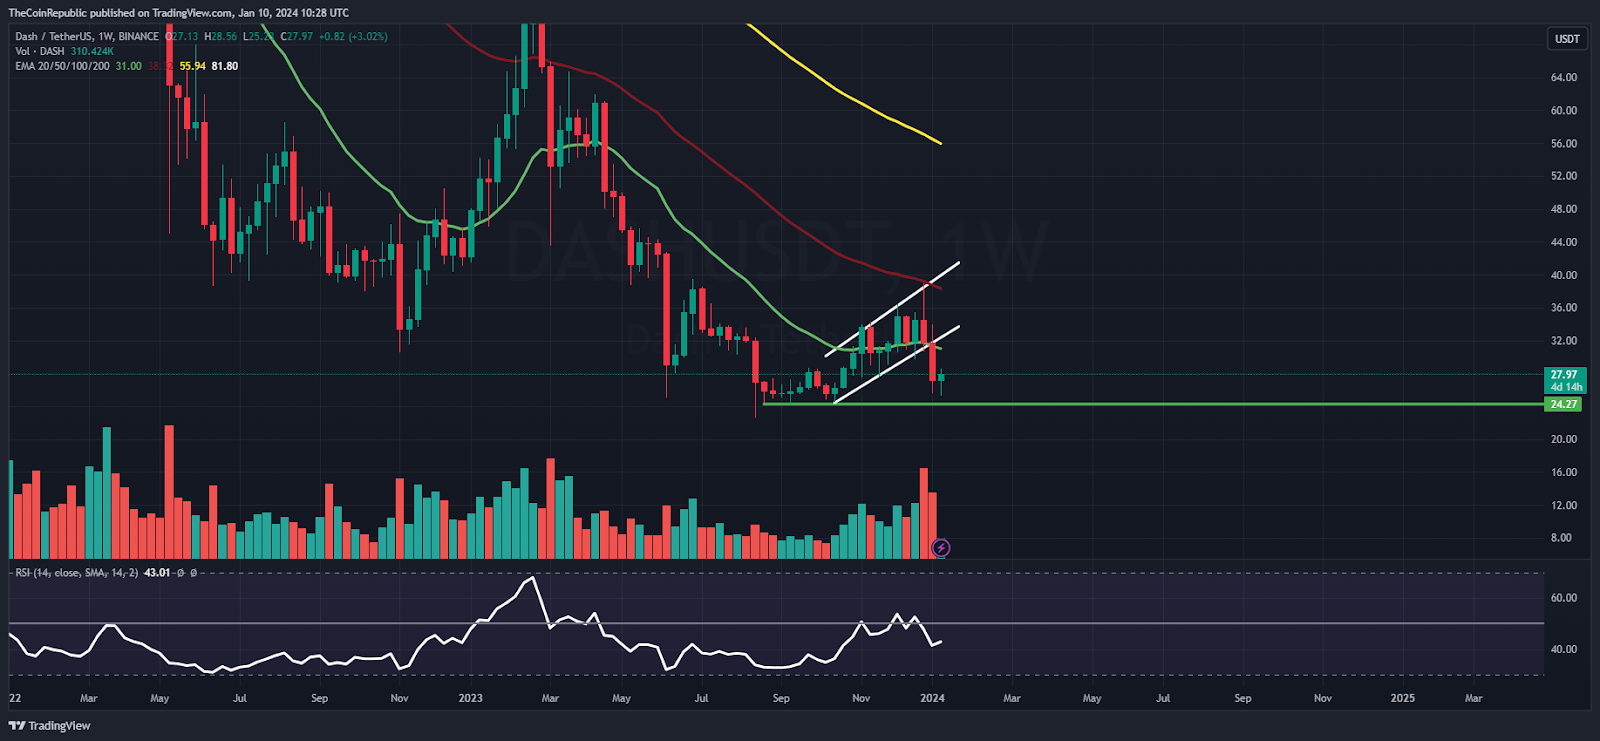
- 1 The DASH price showcased channel breakdown and has slipped below the 20-day EMA mark.
- 2 It may continue to drag the gains and will retest the demand zone soon.
DASH price split the lower trendline of the rising channel and witnessed a breakdown in the recent sessions. Moreover, a death crossover was noted, which is a sign of selling pressure. Besides, the DASH price may continue to drag and might reach $25 in the next session. Amid the uncertainty in the market, the DASH price recovered its gains from the bottom of $20 and went the supply zone above $35 beyond the 200-day EMA mark.
The DASH price did not sustain its gains too long near the supply zone of $40 and faced a sharp rejection which forced DASH to slip below the key moving averages. Followed by the channel breakdown, a bearish crossover was spotted. It gave conviction that sellers have led strength and may continue to add short positions, which might put pressure on bulls.
At press time, DASH is trading at $27.33 with an intraday drop of 3.26%, showing a downtrend on the chart. Moreover, the trading volume increased by 11.20% to $ 40.51 million, highlighting profit booking. The pair of DASH/BTC was noted at 0.000597 BTC, while the market cap is $316.80 Million. Analysts are neutral and suggest that the DASH price will continue to drag in the upcoming sessions.
DASH on Daily Charts Displays Trendline Breakdown
Source: DASH Price Chart By TradingView
The DASH price slipped below the significant moving averages on the daily charts and delivered a breakdown in the recent sessions. Per the breakdown, the DASH coin has an immediate support zone near $25, which may be retested soon. Additionally, the higher high swing was flipped, and a fresh lower low was witnessed, a sign of trend reversal.
The relative strength index (RSI) shows a negative crossover, and the curve is heading toward the oversold region, depicting selling pressure on the charts.
The MACD indicator showed a bearish crossover and formed red bars on the histogram, signifying that the DASH coin may reveal underperformance for the following sessions.
Weekly Charts Exhibit Rejection from 50-Day EMA

Source: DASH Price Chart By TradingView
On the weekly charts, the DASH price showed a sharp push by sellers from the 50-day EMA mark, and bulls have lost their initial gains and are in trouble now. Furthermore, the short-term trend switched from positive to neutral, and the DASH price may drag toward $25 in the following sessions.
Summary
The DASH price showcased a channel breakdown and initiated a down move below the key moving averages, depicting selling pressure on the charts. Moreover, the trend signals the sellers’ dominance and the DASH coin may continue to erode gains and may reach $25 soon.
Technical Levels
Support Levels: $24 and $20
Resistance Levels: $28 and $30
Disclaimer
The views and opinions stated by the author or any other person named in this article are for informational purposes only and do not constitute financial, investment, or other advice. Investing in or trading crypto or stocks comes with a risk of financial loss.
Pratik Chadhokar
Mr. Pratik chadhokar is an Indian Forex, Cryptocurrencies and Financial Market Advisor and analyst with a background in IT and Financial market Strategist. He specialises in market strategies and technical analysis and has spent over a year as a financial markets contributor and observer. He possesses strong technical analytical skills and is well known for his entertaining and informative analysis of the Financial markets.
Read the full article here

