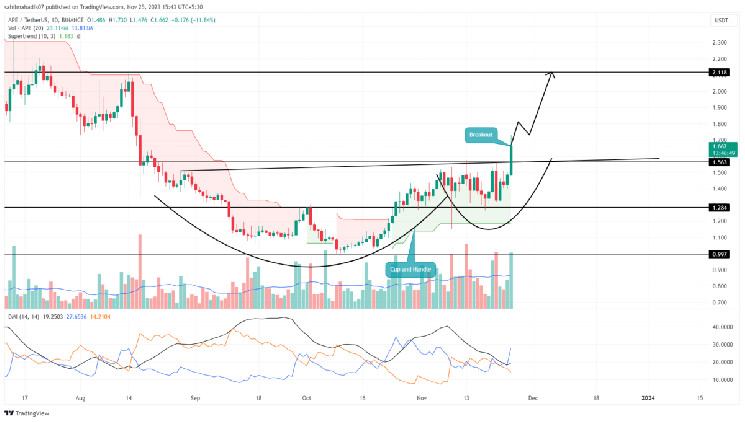
Apecoin Price Prediction: While broader market sentiment is still uncertain, the Metaverse tokens have witnessed a significant uptick today, showcasing double-digit gains in cryptocurrencies like MANA, SAND, APE, etc. In the last 24 hours, the Apecoin price surged 24% and gave a decisive breakout from the neckline resistance of a cup and handle pattern, paving the way for further rally.
Also Read: CME Bitcoin Futures Turns Mega Bullish, BTC Price Rally To $45,000 In Play
Apecoin Price Prediction: Can $APE Price Regain $2?
- The formation of Cup and handle patterns is often spotted at market bottoms indicating an opportunity for new recovery.
- A decisive breakout from the pattern’s neckline resistance set a 27.5% upswing.
- The intraday trading volume in APE is $169.5 Million, indicating a 245% gain.
Source- Tradingview
In 2023, the Apecoin price experienced a significant downtrend, with its price plummeting from a high of $6 to a low of $1. However, the tide began to turn for APE in mid-October, marking the start of a recovery phase in the broader cryptocurrency market. Since then, the coin price has found solid footing at the $1 psychological level, laying the foundation for a new upward trajectory.
From its October 10th low of $1.02, the APE price has witnessed a 65% surge, currently trading around $1.66. This recovery phase is characterized by the formation of a ‘Cup and Handle‘ pattern on the daily time frame chart, a widely recognized bullish reversal pattern. The pattern’s completion was marked by a 12% intraday rise and a noticeable increase in trading volume, culminating in a decisive breakout from the pattern’s neckline resistance.
The upcoming week is pivotal for APE investors as it will test the sustainability of this breakout and its potential for further rallies. If the pattern plays out as expected, the coin price could witness a 27% increase in value, potentially reaching the $2.11 mark.
Key Levels to Watch
Throughout its ongoing rally, APE has undergone two significant corrections. The first retracement was at the 61.8% Fibonacci level, followed by a second correction at 50%. The diminishing depth of these retracements is a bullish indicator, signifying growing momentum and stronger buyer conviction. In light of this, investors can consider the 38.2% and 50% Fibonacci levels as strategic points for setting stop-loss orders, providing a safety net against potential market volatility.
- Average Directional Index: the ADX growth uptake near this 19% mark is a sign of strong growth opportunity ahead.
- Supertend Indicator: A green film projected on this trend defining Indicator accentuates the short-term trend is bullish.
Read the full article here

