In two separate posts on X, dated January 7, the influencer Crypto Tony urged his followers participants not to miss out on Optimism’s (OP) and Arbitrum’s (ARB) next rallies.
For ARB, the trader shared a weekly chart showing a bullish structure for the cryptocurrency. However, Tony opined that the price has to close above $1.86 to confirm a sustained uptrend.
$ARB / $USD
However, ARB’s performance in the last 24 hours may be a stumbling block to Tony’s prediction. According to CoinMarketCap, ARB’s price at press time was $1.64, indicating a 9.15% value decrease within the said period.
ARB Eyes $1.72 for a Start
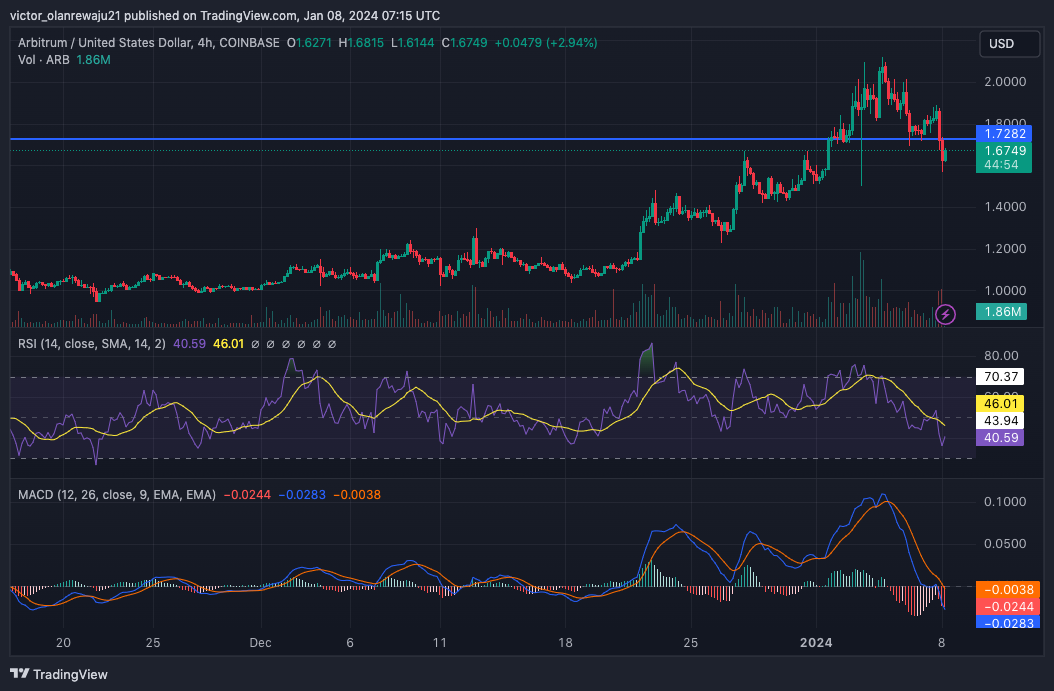
ARB’s sharp correction happened on January 7 as the price plunged from $1.86. However, it seems that bulls are trying to halt the correction, defending ARB at $1.65.
Indications from the RSI showed a weakening upward momentum since the reading was 40.29. But signs from the RSI revealed that ARB might rebound. However, this might only be the case if the RSI heads to the 50.00 midpoint.
In this instance, buyers would have filled the dips. If the bullish momentum picks up, then ARB might close above $1.72.
On the contrary, the Moving Average Convergence Divergence (MACD) did not support a quick recovery. At press time, the MACD was -0.024. Also, the 12-day EMA (blue) had crossed below the 26-day EMA (orange).

ARB/USD 4-Hour Chart (Source: TradingView)
The crossover depicts an increasing downward momentum. Unless bulls come to ARB’s rescue as stated earlier, the price could continue correcting.
OP Aims to Rebound
Tony’s second post was about OP. In the post, Tony encouraged his followers to accumulate the token before its next rally.
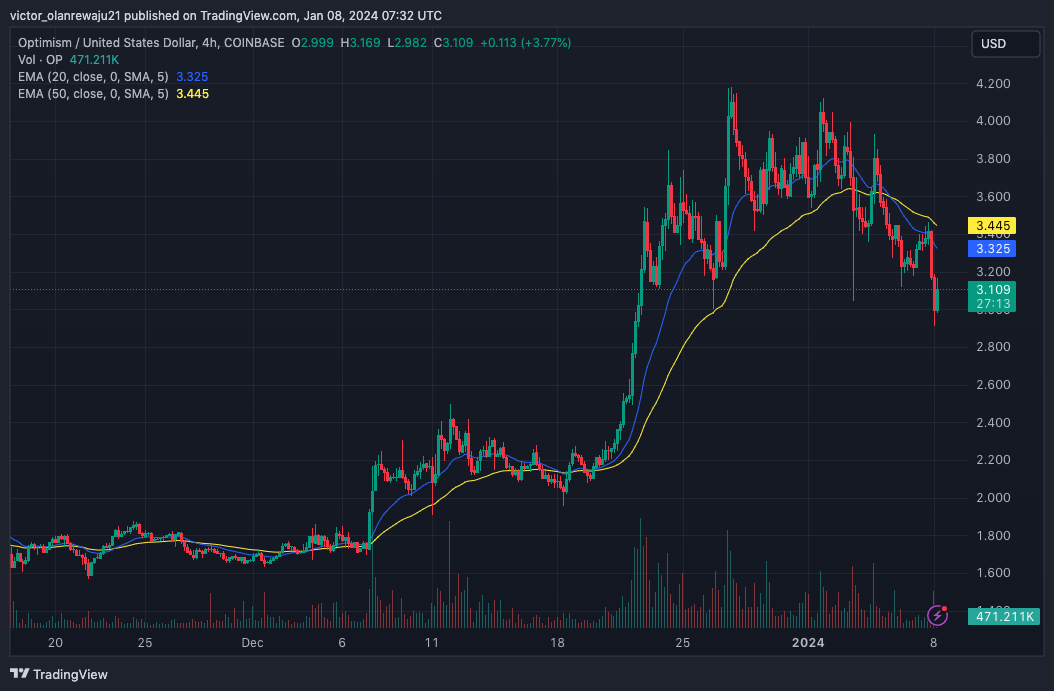
At that time, OP’s price was above $3.20. But like ARB, OP had a similar 24-hour fall, shedding 9.03% of its value in the process.
However, it is important to mention that corrections like these could be healthy. In OP’s case, the 4-hour structure was similar to ARB. This movement was not surprising considering the strong correlation between the two cryptocurrencies.
OP showed signs of recovering as it moved up to $3.10 after briefly trading below $3. Furthermore, OP closed below the 20 EMA (blue) at $3.32. This suggests that a quick recovery might take a little while before becoming a reality.

OP/USD 4-Hour Chart (Source: TradingView)
The 50 EMA (yellow) also positioned at $3.44. So, if bulls push the price above the 20 EMA, OP might face resistance at $3.44 considering the bearish crossover. But as long as buying pressure intensifies, a breach of the zone might be possible.
Disclaimer: The information presented in this article is for informational and educational purposes only. The article does not constitute financial advice or advice of any kind. Coin Edition is not responsible for any losses incurred as a result of the utilization of content, products, or services mentioned. Readers are advised to exercise caution before taking any action related to the company.
Read the full article here

