Toncoin price rose by another 6.5% on Friday Aug, hitting a weekly peak of $6.81, here’s why TON rally intensified while rival mega cap assets retreated.
TON Skips Ahead of Market Average With another 6.5% Rally
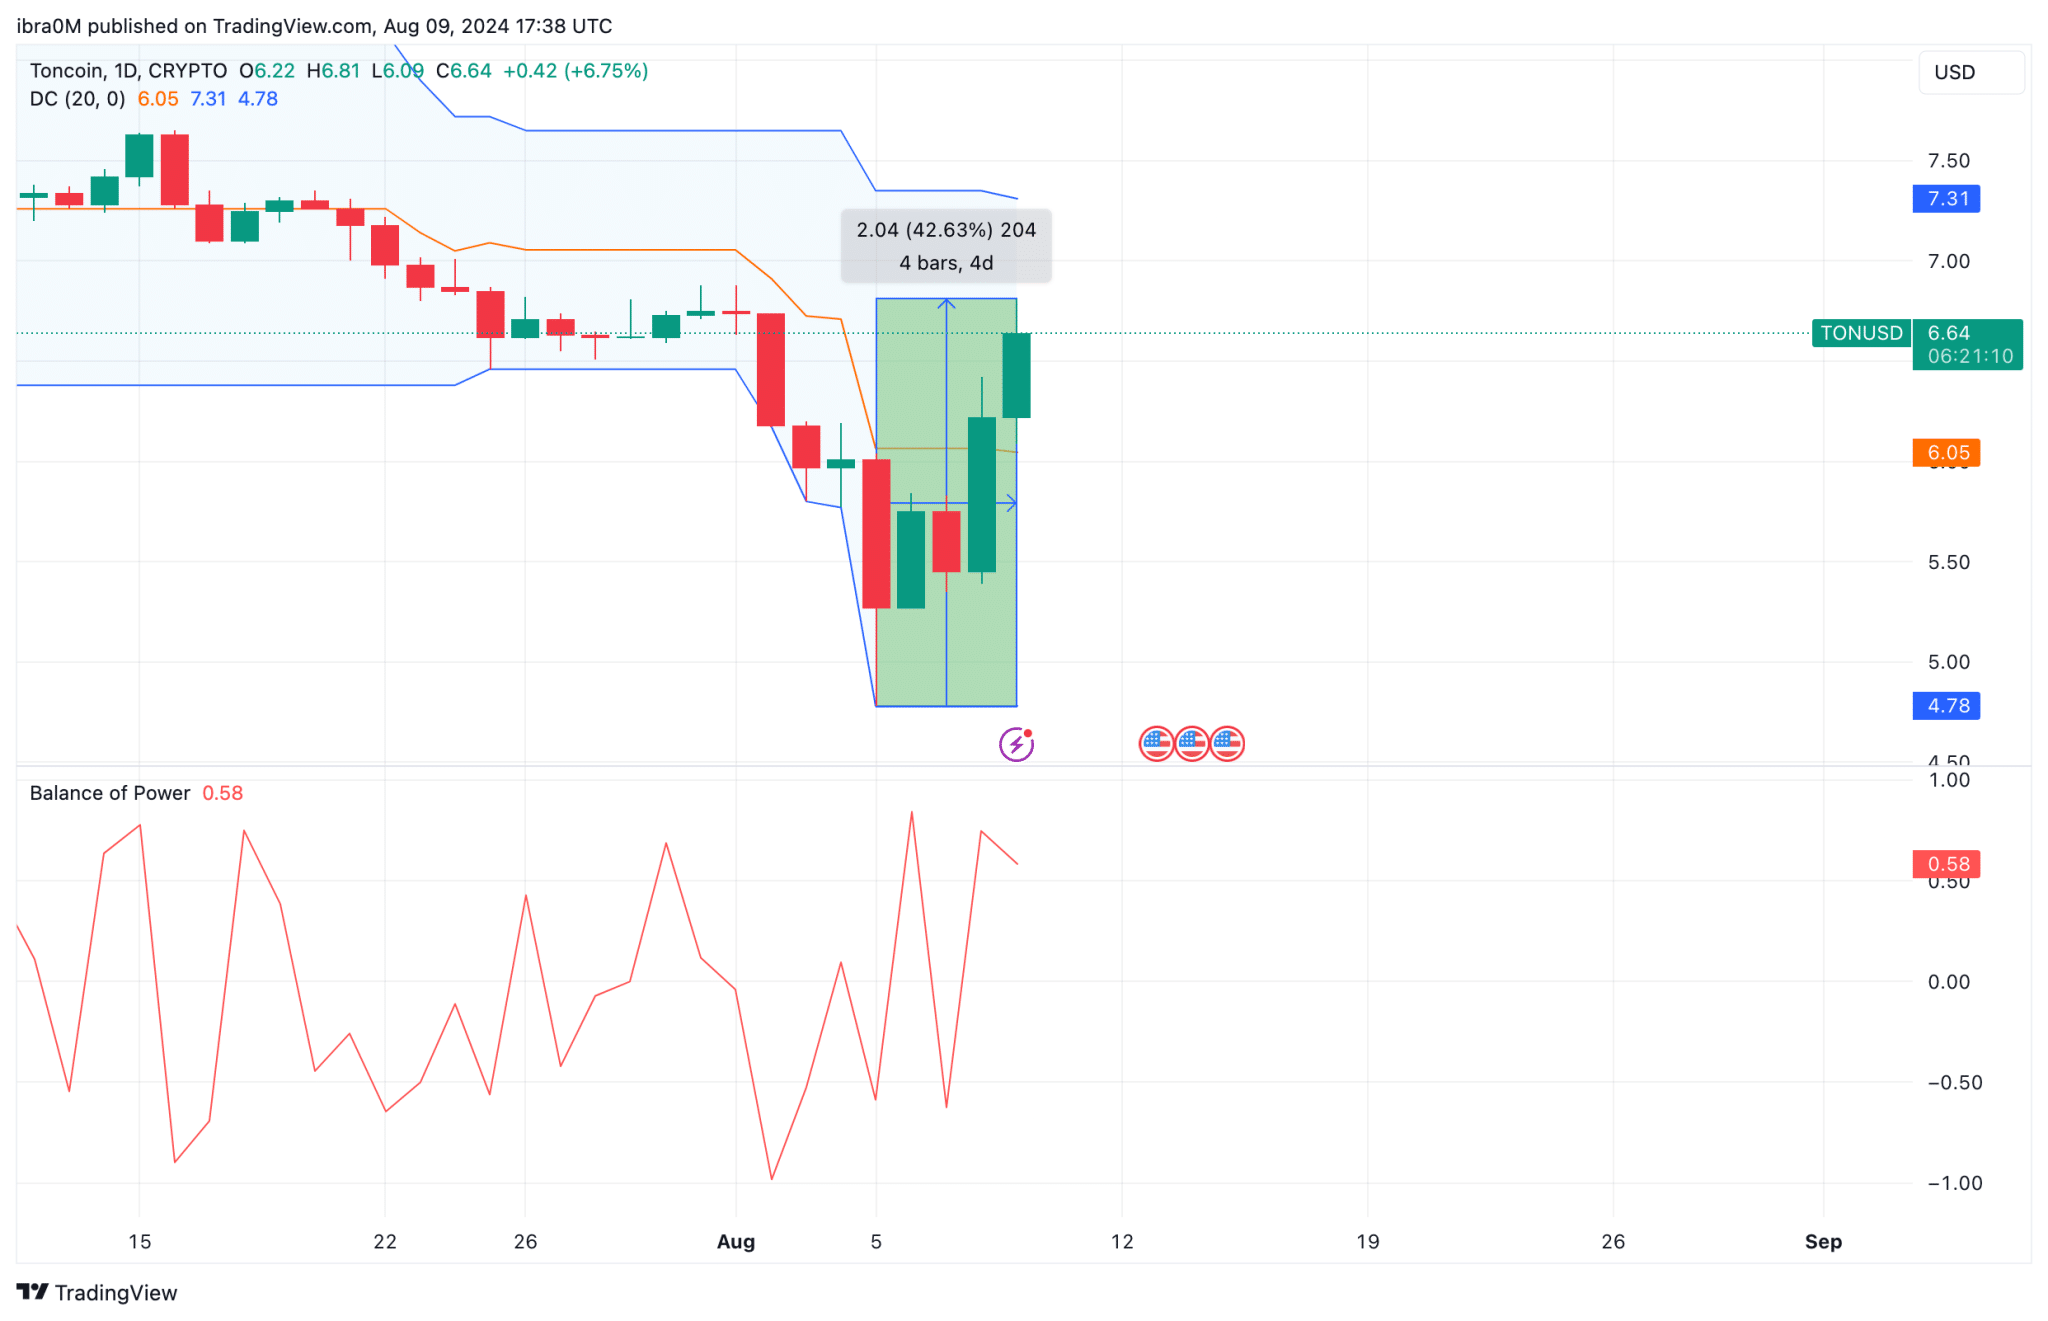
Toncoin price action this week has been nothing short of volatile, starting the week on a negative note, as it crashed to a 3-month low of $4.78 on August 5 as market-wide bearish sentiment weighed heavily on prices.
However, TON quickly reversed course, thanks to several bullish catalysts that provided a much-needed boost to its price.
One of the key drivers behind TON’s rally was the significant inflow of capital into exchange-traded funds (ETFs) focused on blockchain and digital assets.
These inflows signaled growing institutional interest in the space, providing a tailwind for cryptocurrencies like TON. Additionally, the recent $125 million fine imposed on Ripple by the U.S. Securities and Exchange Commission (SEC) created a temporary shift in investor sentiment, as some traders rotated capital into other altcoins, including Toncoin.
Toncoin Price Action TONUSD | TradingView
Another major factor contributing to TON’s rally was Russia’s move to legalize crypto mining. This development was particularly impactful for TON, as the cryptocurrency has strong ties to the Russian market. The legalization of mining not only provided a regulatory boost but also increased confidence among investors that Toncoin would continue to see adoption and usage in the region.
By August 9, TON had surged by a staggering 42% from its August 5 low, breaking above the $6.80 resistance level with another 6.5% rally. This breakout allowed TON to outperform other major cryptocurrencies, such as Ethereum and Shiba Inu, which faced resistance and subsequently pulled back on the same day.
Toncoin Network Usage Surged Amid Market Crash
While the broader cryptocurrency market faced significant headwinds, Toncoin’s network activity remained resilient. The number of Daily Active Addresses (DAA) on the Toncoin blockchain saw a notable increase, rising from 682,680 on August 4 to 846,820 on August 8.
The Daily Active Addresses metric, which tracks the number of unique addresses involved in transactions on a given day, is a crucial indicator of network health and user engagement.

Toncoin Price vs TON Daily Active Addresses | IntoTheBlock
The surge in DAA suggests that, despite the market downturn, Toncoin’s user base remained active, potentially driven by the aforementioned regulatory developments and increased interest from institutional investors.
This steady network activity likely set the stage for the strong breakout TON experienced on August 9. The increased engagement could be seen as a bullish signal, indicating that the cryptocurrency’s fundamentals remain strong. As such, this uptick in network activity may hint at further upward price action in the near future.
TON Price Forecast: More Consolidation Before $7 Breakout
Toncoin’s recent rally has undoubtedly caught the attention of traders, but a period of consolidation may be on the horizon before another significant breakout occurs. The Donchian Channels indicator suggests that TON is currently trading near the upper boundary, with support around $6.05 and resistance at $7.31.
Given the balance of power and the current bullish momentum, it is likely that TON will continue to consolidate within this range in the short term.

Toncoin Price Forecast | TONUSD
However, a successful breach of the $6.81 resistance level could pave the way for a move towards $7.50 or even higher. On the downside, should TON fail to hold above the $6.05 support, a pullback to the $5.50 level could be in play.
Overall, the technical indicators lean bullish, with the potential for further gains as long as TON maintains its current momentum. Traders should keep an eye on the $6.81 resistance level, as a breakout above this point could signal the start of the next leg higher.
Read the full article here

