Ordinals (ORDI) price has recently made headlines with its impressive market performance. A recent analysis shows ORDI price movements have revealed the golden ratio per Fibonacci retracement. This positioning is crucial, as it often indicates a potential for price bounce, marking an opportune moment for traders to consider entry.
Moreover, in the last 24 hours, bullish momentum has had the upper hand, with the price soaring from an intra-day low of $21.01 to an all-time high of $29.35. Consequently, ORDI has recorded the most gains ranking first in the CoinMarketCap top gainers.
ORDI/USD price chart
Bullish Indicators Strengthen Confidence in ORDI
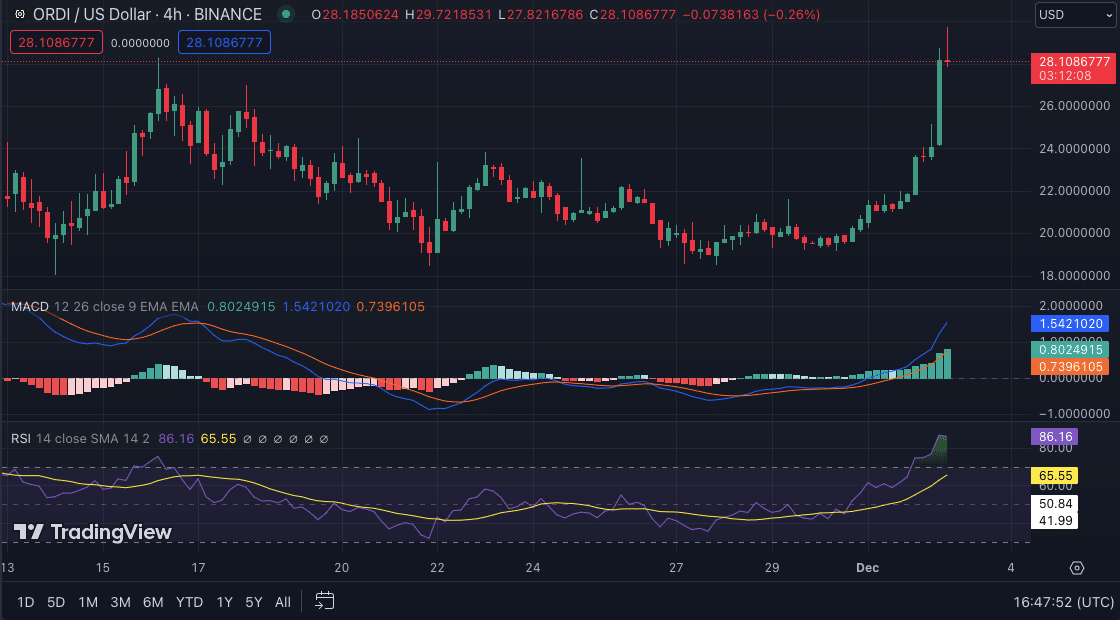
Moreover, reinforcing the bullish perspective is a critical technical indicator. The Relative Strength Index (RSI) and the Moving Average Convergence Divergence (MACD) on the 4-hour chart exhibit bullish trends.
Notably, the RSI is at 90.24, suggesting an overbought condition, which may signal a potential price pullback. However, this is coupled with positive momentum from the MACD, indicating sustained buyer interest and the likelihood of continued price appreciation.

ORDI/USD price chart (source: TradingView)
Market Structure Points to Upcoming Breakout
The market structure of ORDI adds further weight to the bullish sentiment. The asset has been consistently registering higher lows, a pattern often preceding a breakout from the prevailing trendline, followed by the formation of a higher high. This pattern indicates bullish solid momentum and is a critical factor for traders to consider in their strategic planning.
Recent price action on the 1-hour chart has provided tangible benefits for strategic traders. Confirming a trendline breakout offered a compelling entry point, optimally utilized by taking profits at the recent swing high. This move highlights the importance of timely market entry and exit strategies in maximizing returns.
Read Also: SEC Veteran Calls Crypto “Mammoth Ponzi Scheme”
Read the full article here

