
- 1 MYRO crypto price signifies selling pressure and is heading toward the demand zone.
- 2 The buyers have lost strength and are unwinding their long positions.
The MYRO crypto fell from the high of $0.2500, replicating selling pressure in the last sessions. Moreover, the crypto price eroded over 80% from the highs, representing a massive trend reversal. The price action conveys the short build-up activity and the mighty bears have gained strength and persist in distributing gains from the highs.
The MYRO crypto price dropped below the significant moving averages and depicted a downtrend on the charts. Moreover, the crypto price showcased a bearish marubozu candlestick and sharply breached the 50-day EMA, indicating sellers’ dominance. Followed by the market correction, the MYRO crypto has persisted in dragging gains and is heading toward the demand zone of $0.04000.
The price of the cryptocurrency was $0.05713 at press time, with an intraday drop of 39.43%, showing bearishness on the charts. Moreover, the trading volume increased by 162.10% to $49.15 Million, highlighting an intense selloff. The pair of MYRO/BTC was noted at 0.00000134 BTC, and the market cap is $57.17 Million. Analysts are bearish and suggest that the MYRO price will continue to drag the gains and retest $0.04000 soon.
The MYRO Crypto on Daily Charts Reveals Intense Selloff
Source: MYRO Price Chart By TradingView
On the daily charts, the MYRO crypto price went through a massive correction. It breached multiple support zones and displayed an intense selloff. Furthermore, the crypto price has fallen to a bearish trajectory and investors are in crisis. The trend is favoring the bears and suggests underperformance in the recent sessions. However, the crypto price awaits a lower high formation, which is pending, and follow-on selling pressure was noted which is a negative sign.
The RSI curve sharply slipped to the oversold region and formed a negative divergence, which indicates bearishness on the charts. Moreover, the MACD indicator shows a bearish crossover, and the red bars formed on the histogram. It suggests underperformance for the upcoming sessions.
The MYRO Crypto Price on Hourly Charts Displays Breakdown
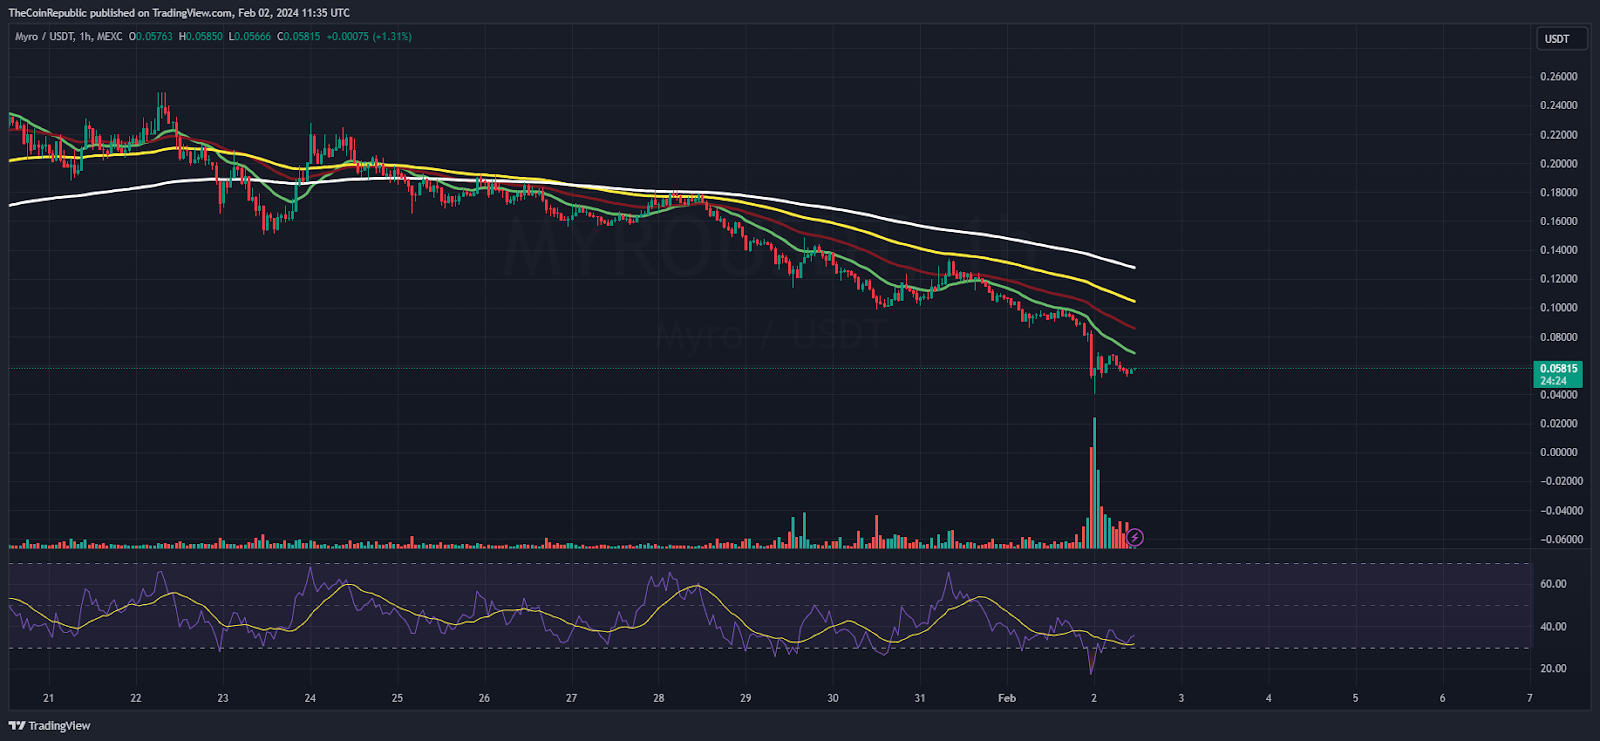
Source: MYRO Price Chart By TradingView
On the hourly charts, the MYRO price has fled the neutral region and joined the bearish region, resulting in a solemn selloff. Moreover, the crypto price has tumbled over 35% intraday, indicating that a major block of sellers is now arriving. Per the Fib levels, the price has slipped below the 23.6% zone and is heading toward $0.04000.
Summary
The MYRO crypto price has slipped below the make-or-break region and an intense selloff was witnessed in the last session. The price of this crypto has come into the sellers’ hands and further downside action will continue, dragging the MYRO price toward $0.04000 in the upcoming sessions.
Technical Levels
Support Levels: $0.05200 and $0.05000
Resistance Levels: $0.06000 and $0.06500
Disclaimer
The views and opinions stated by the author or any other person named in this article are for informational purposes only and do not constitute financial, investment, or other advice. Investing in or trading crypto or stocks comes with a risk of financial loss.
Andrew Smith
Andrew is a blockchain developer who developed his interest in cryptocurrencies while pursuing his post-graduation major in blockchain development. He is a keen observer of details and shares his passion for writing, along with coding. His backend knowledge about blockchain helps him give a unique perspective to his writing skills, and a reliable craft at explaining the concepts such as blockchain programming, languages and token minting. He also frequently shares technical details and performance indicators of ICOs and IDOs.
Read the full article here