 Support Holds Firm – What’s Driving Its Resilience?")
The Litecoin (LTC) price has consolidated above a long-term support level since August 2023.
Litecoin trades in a short-term corrective pattern and descending resistance trend line. Will it break down from them, or will it bounce at the long-term support level instead?
Litecoin Trades Above Support
The weekly time frame outlook shows that LTC has increased alongside an ascending support trend line since June 2022. The trend line has been validated numerous times (green icons).
Initially, the bounces triggered significant upward movements. However, they have been much smaller recently. Two weeks ago, Litecoin bounced at the support trend line and has already returned to it.
The long-term ascending support trend line has existed for 610 days and coincides with a horizontal support area.
LTC/USDT Weekly Chart. Source: TradingView
The weekly Relative Strength Index (RS) gives a mixed reading. Market traders use the RSI as a momentum indicator to identify overbought or oversold conditions and to decide whether to accumulate or sell an asset.
Readings above 50 and an upward trend indicate that bulls still have an advantage, whereas readings below 50 suggest the opposite. While the indicator is increasing, it is still below 50 (red circle), indicating an undetermined trend.
What Are Analysts Saying?
Cryptocurrency traders and analysts on X positively view the future LTC trend.
Master believes that LTC will be above $5,000 by the end of the year, using a previous fractal to come to the prediction.
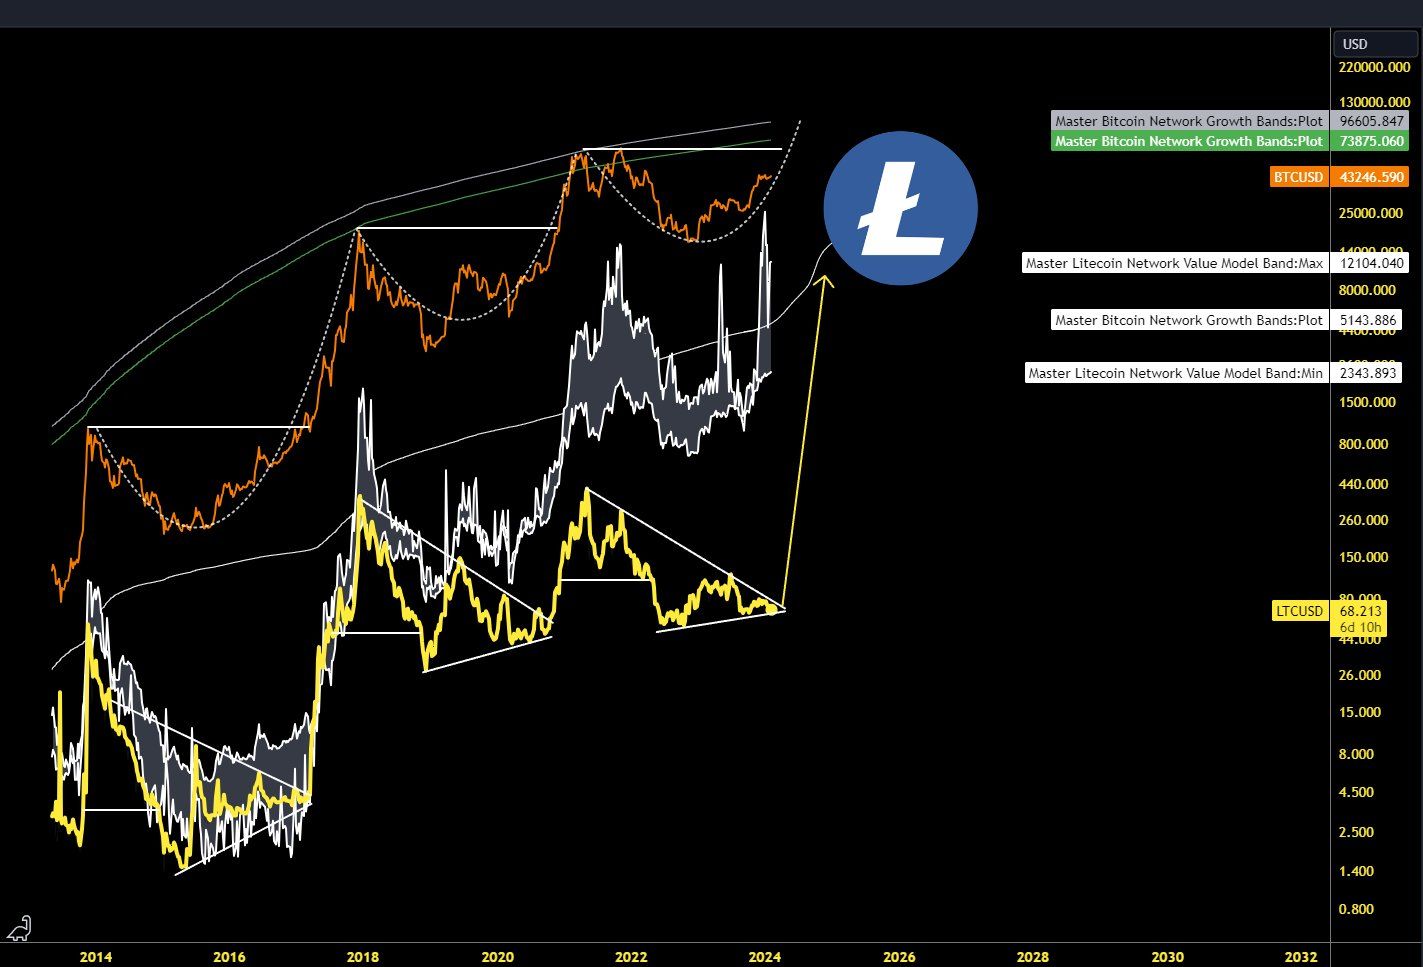
LTC/USDT Weekly Chart. Source: X
TJCrypto believes the price is consolidating in anticipation of an upward movement. After the Solana network went down, RoboTrader had this to say:
meanwhile Litecoin has never ever been down in its entire existence from 2011 #LTC $LTC
LTC Price Prediction: Will Breakdown Occur?
The technical analysis of the daily time frame suggests a breakdown is expected because of the bearish price action.
The chart shows LTC has traded in an ascending parallel channel since September 2023. These channels usually contain corrective movements, meaning a breakdown is expected.
Furthermore, LTC trades in the channel’s lower portion and follows a descending resistance trend line. As a result, a breakdown from the channel is the most likely future price scenario.
The daily RSI aligns with this scenario since the indicator faces resistance from 50 (red circle).
LTC can fall by nearly 27% to the closest support area at $50 if a breakdown occurs.
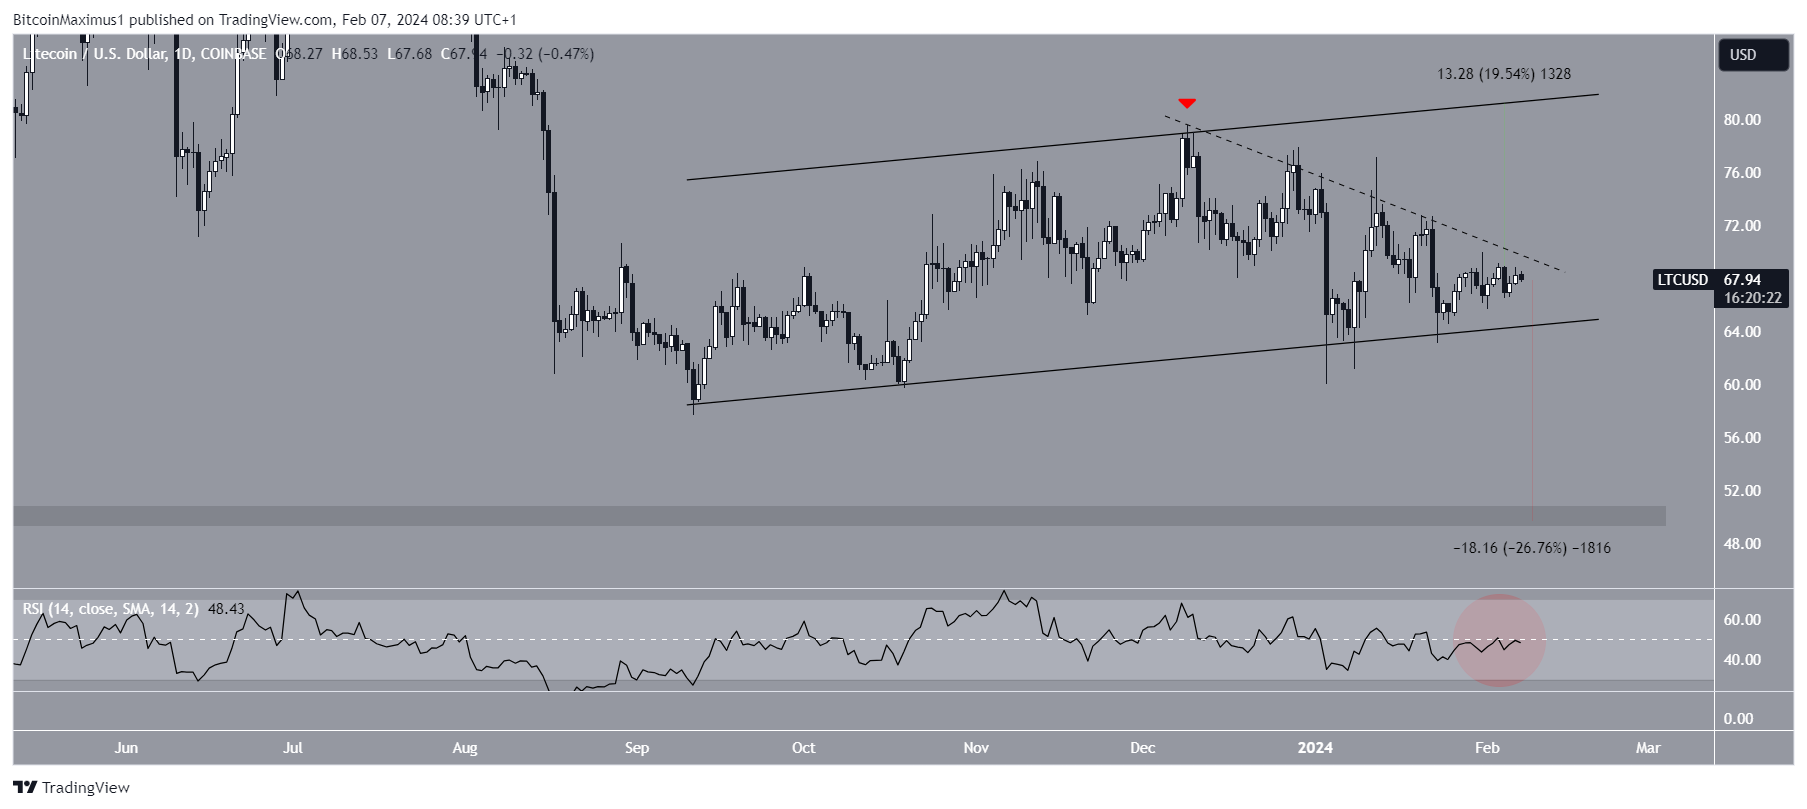
LTC/USD Daily Chart. Source: TradingView
Despite this bearish LTC price prediction, a breakout from the descending resistance trend line can trigger a 20% increase to the ascending resistance trend line at $82.
For BeInCrypto‘s latest crypto market analysis, click here.
Disclaimer
In line with the Trust Project guidelines, this price analysis article is for informational purposes only and should not be considered financial or investment advice. BeInCrypto is committed to accurate, unbiased reporting, but market conditions are subject to change without notice. Always conduct your own research and consult with a professional before making any financial decisions. Please note that our Terms and Conditions, Privacy Policy, and Disclaimers have been updated.
Read the full article here