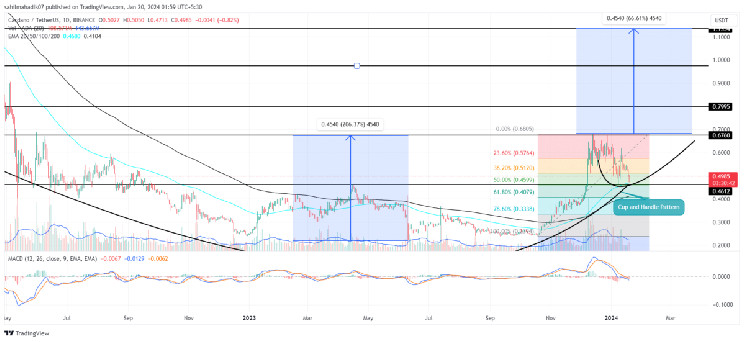
Cardano Price Prediction: Cardano (ADA) has been experiencing a corrective phase for the past three weeks, largely influenced by the broader market’s uncertainty, especially around the Bitcoin ETF launch. From a recent high of $0.677, the ADA price has fallen by approximately 30%, currently trading around $0.497. Despite this downturn, there is a silver lining: the formation of a Bullish Reversal Pattern Token. This suggests a potential opportunity for buyers to re-ignite the coin’s recovery trend.
Cardano Price Wavers At Key Reversal Point
- A cup and handle pattern leads the current recovery trend
- The confluence of technical support strengths the support regions at $0.46
- The intraday trading volume in the ADA coin is $829 Million, indicating a 1.4% gain
Over the last seven months, the Cardano price movement has been largely stagnant, struggling to consistently stay above the $0.7 threshold. This prolonged sideways trend has gradually morphed into a bullish ‘cup and handle’ pattern.
This pattern is often seen as a precursor to the bottoming out of an asset’s price, followed by a sustainable recovery. Currently, ADA is in the process of forming the ‘handle,’ a minor correction phase that typically gathers bullish momentum for a breakout above key resistance levels.
With increasing buying pressure near the $0.46 support level, there is potential for a 35% rise in ADA’s price, challenging the neckline resistance at $0.677.
A decisive breakout above this level could be an early indicator of a reversal, possibly driving the price up by another 66% to a target of $1.135.
Is ADA Price At Risk for Another Correction?
The Daily Time Frame Chart for ADA shows a long-tail rejection candle at the $0.46 support level, indicating continued buyer interest during price dips. This support level, reinforced by the 50% Fibonacci retracement level and the 100-day Exponential Moving Average (EMA), forms a strong demand zone, laying the groundwork for a bullish reversal. However, if buyers fail to maintain this critical area, it could signify stronger selling pressure, leading to a potential extended decline and invalidating the bullish pattern.
- Exponential Moving Average: the coin price trading above 100-and-200 EMA reflects the overall trend is still bullish.
- Moving Average Convergence Divergence: the MACD and signal line drop below this midline reflect the sellers are currently the key driving force of this asset’s price movement.
Read the full article here

