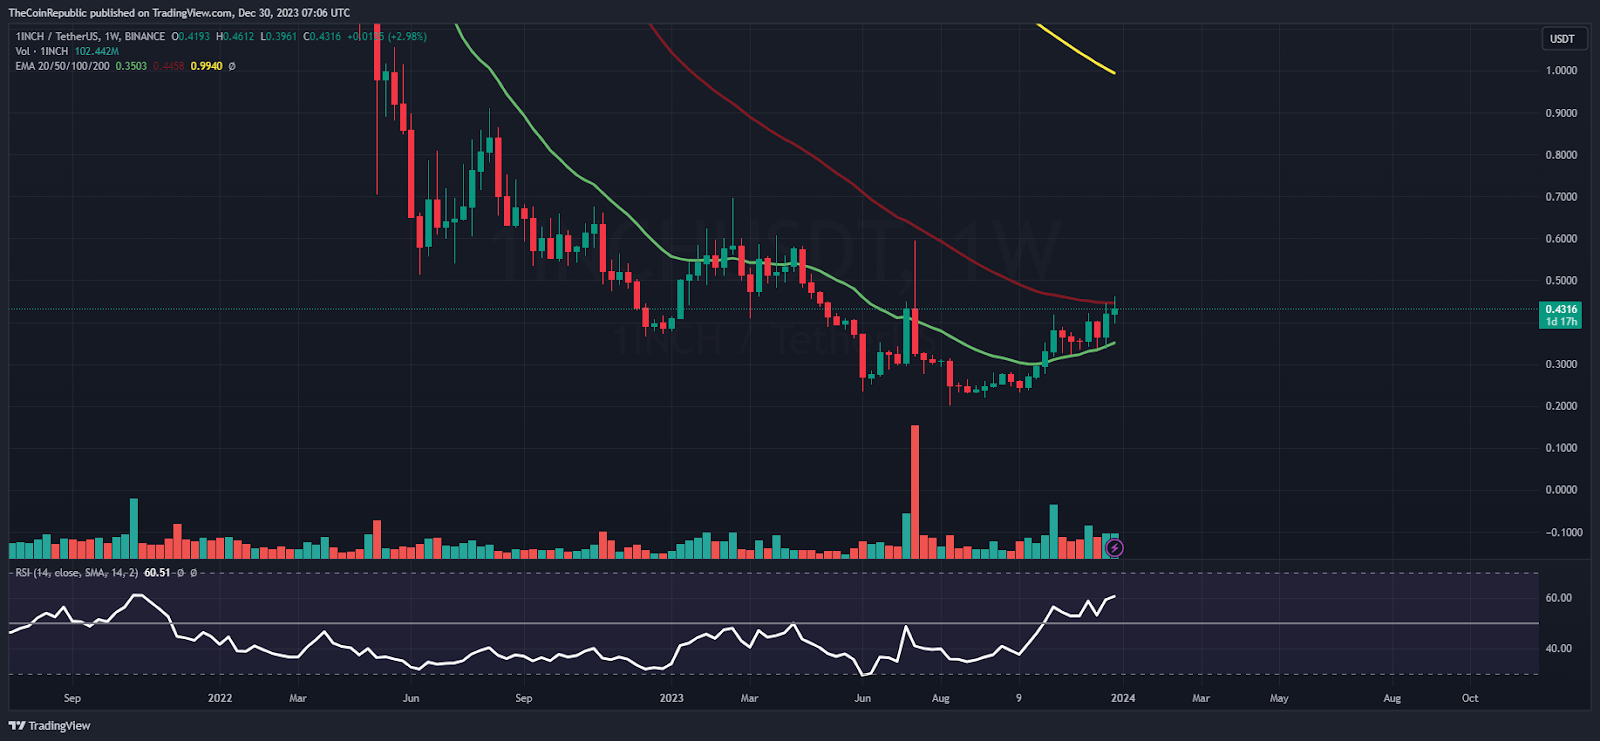
- 1 1INCH price showcased bullish bias and marked higher highs on the chart.
- 2 Buyers have gained momentum and are trying to overtake the $0.5000 mark.
1INCH price is trading close to the make-or-break zone of $0.5000, and buyers are trying to crash the supply zone. Moreover, the price action shows that the trend is intact, and a rally can be anticipated above $0.5000. Furthermore, the chart shows the bullish flag pattern, which confirms that the 1INCH token is likely to show a boost in gains, smashing the supply zone.
1INCH token price is trading above the key moving averages in a bullish channel and guides a bullish stance on the chart. Moreover, the trend suggests that follow-on buying was witnessed, and buyers are challenged to escape the region. Per the Fibonacci retracement levels, 1INCH token is above the 50% zone and is close to the upper bollinger band.
The live price of 1INCH token is $04317, with an intraday drop of 2.23%, showing neutrality on the chart. Moreover, the trading volume increased by 7.78% to $43.21 Million. However, the pair of 1INCH/BTC is at 0.00000104 BTC, and the market cap is $492.30 Million. Analysts have maintained a neutral rating, suggesting that the rally will continue in the following sessions.
1INCH on Daily Chart Displays Bullish Flag Pattern
Source: 1INCH/USD Chart by TradingView
On the daily chart, 1INCH price has showcased a trend reversal and persisted in delivering a bounce from the 20-day EMA. Moreover, the technicals suggest a bullish stance, and a further short-covering rally is expected above the $0.5000 mark.
The relative strength index (RSI) curve stayed above the midline and formed a positive divergence, suggesting neutral projections for the following sessions. The MACD indicator shows a bullish crossover and formed green bars on the histogram, implying that the 1INCH token will continue to gain in the following sessions.
Will 1INCH Token Succeed to Surpass 20 Day EMA Hurdle?

Source: 1INCH/USD Chart by TradingView
On the weekly chart, the 1INCH token price has acquired momentum and topped the trendline of the falling wedge pattern, suggesting a bullish outlook in recent sessions. However, the token is trading close to the 20-day EMA mark and is facing resistance near the hurdle of $0.4600. Also, a rejection candlestick was spotted on the chart.
Summary
1INCH price is back from the demand zone of $0.2000 and has produced a V-shaped reversal in the recent sessions. Moreover, the technical indicators generate a buy alert and reflect a positive crossover, giving a solid belief that the 1INCH token will surpass the $0.5000 mark soon.
Technical Levels
Support Levels: $0.0.4200 and $0.4000
Resistance Levels: $0.4700 and $0.5000
Disclaimer
The views and opinions stated by the author or any other person named in this article are for informational purposes only and do not constitute financial, investment, or other advice. Investing in or trading crypto or stocks comes with a risk of financial loss.
Ritika Sharma
With a background in journalism, Ritika Sharma has worked with many reputed media firms focusing on general news such as politics and crime. She joined The Coin Republic as a reporter for crypto, and found a great passion for cryptocurrency, Web3, NFTs and other digital assets. She spends a lot of time researching and delving deeper into these concepts around the clock, and is a strong advocate for women in STEM.
Read the full article here

