- 1 The IOTA crypto price signifies tiny candlesticks, signifying low investor interest.
- 2 IOTA token witnessed low trading volume, which impacted the investors.
The IOTA price was in a correction phase and did not showcase any significant bounce for the past sessions. The price action signified the low trading volume and did not reflect any considerable buying activity, indicating lower investor interest. Moreover, the token must cross the upside of $0.3000 for a fresh bull rally toward $0.5000.
IOTA token price has sustained gains above the 20-day EMA region and is displaying neutrality on the charts. Per the Fib retracement levels, the token has sustained gains above the 23.6% zone and has not succeeded in escaping the 38.2% zone for the past weeks.
The IOTA token (MIOTA) price was $0.2658 at press time, with an intraday drop of 5.02%, reflecting neutrality on the charts. Moreover, the trading volume increased by 2.46% to $19.14 Million. The pair of IOTA/BTC is at 0.00000513 BTC, and the market cap is $597.89 Million. Analysts are neutral and suggest that the token may continue to face lower investor interest and did not see any vast upside for the following sessions.
IOTA on Daily Charts Displays Falling Channel Breakout
Source: IOTA Price Chart By TradingView
On the daily charts, the MIOTA price signifies a lower low swing and has witnessed correction from the highs of $0.3800 in the last weeks. Moreover, the token has yet to confirm the breakout with a significant bounce with buying volume, awaiting a trustworthy breakout by the investors. However, the trendline was breached, but favorable upside signs still need to be replicated.
The Relative Strength Index (RSI) curve is stuck near the neutral zone, revealing a negative divergence directing low investor interest. Similarly, the MACD indicator shows a bearish crossover and reflects signs of a downtrend for the upcoming sessions.
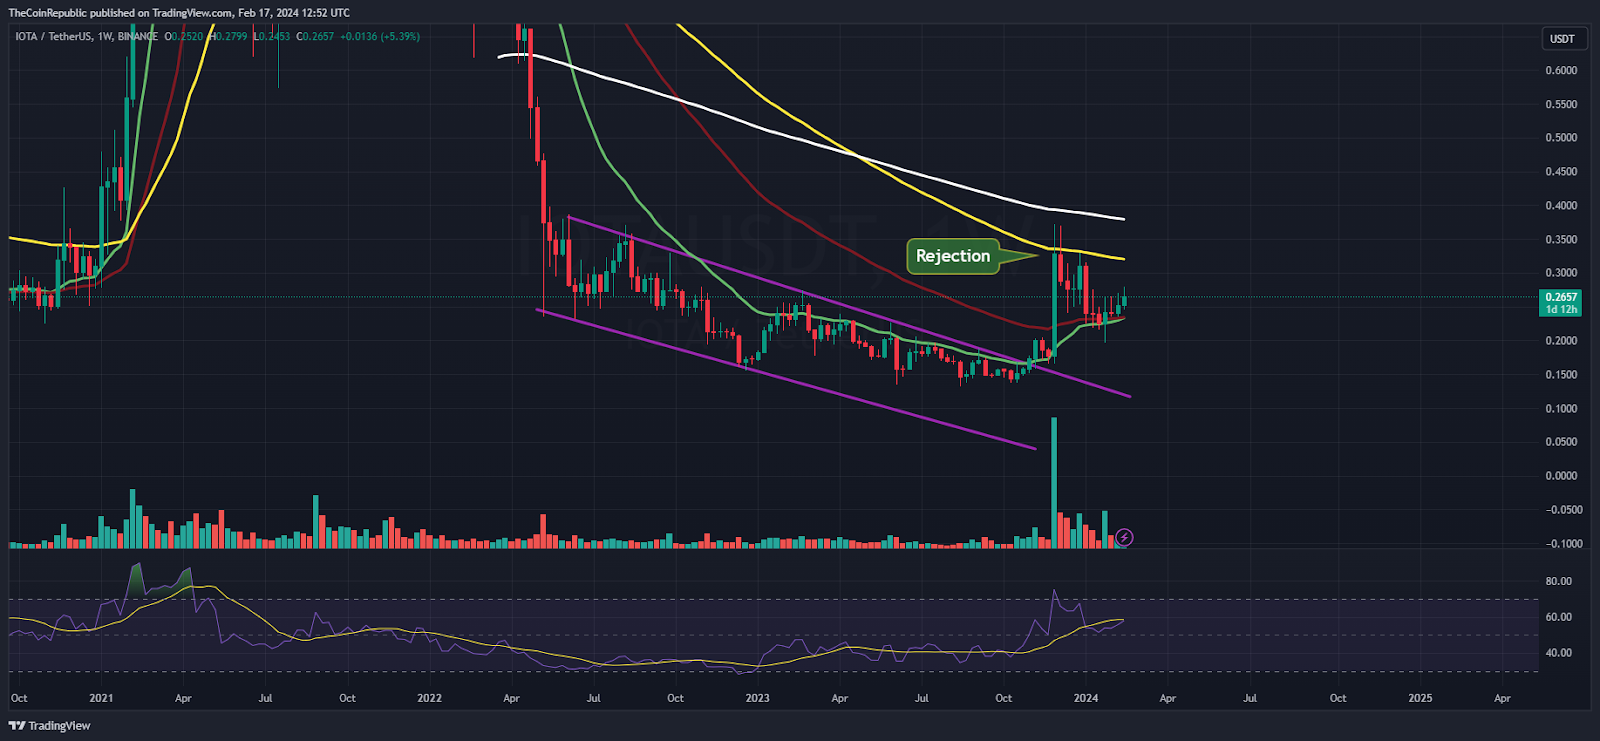
IOTA on Weekly Charts Reveals Rejection from the 100-day EMA

Source: IOTA Price Chart By TradingView
On the weekly charts, the IOTA price has reversed from the demand zone of $0.1300 and recovered over 80%. However, the bulls escaped the 50-day EMA but did not cross the 100-day EMA, which acted as a significant hurdle for the past sessions. Amid multiple attempts, the token could not surpass the zone and was traded below it. Fresh buying will be possible once the 100-day EMA mark is breached.
Summary
The IOTA token price stayed in the bearish region and displayed range-bound moves reflecting low trading volume. Moreover, the price action signifies rejection from the highs of $0.3000, reflecting the sellers’ dominance. If the token succeeds in crossing the 100-day EMA mark, fresh buying action may be seen.
Technical Levels
Support Levels: $0.2400 and $0.2200
Resistance Levels:$0.2800 and $03000
Disclaimer
The views and opinions stated by the author or any other person named in this article are for informational purposes only and do not constitute financial, investment, or other advice. Investing in or trading crypto or stocks comes with a risk of financial loss.
Nancy J. Allen
Nancy J. Allen is a crypto enthusiast, with a major in macroeconomics and minor in business statistics. She believes that cryptocurrencies inspire people to be their own banks, and step aside from traditional monetary exchange systems. She is also intrigued by blockchain technology and its functioning. She frequently researches, and posts content on the top altcoins, their theoretical working principles and technical price predictions.
Read the full article here

