Technical analysis is an important indicator that investors, especially those trading in the futures market, need to constantly follow in the cryptocurrency market. So, what clues does technical analysis give us for ApeCoin, which is currently trading at $1,720, and Blur, which is trading at $0.5984? Let’s examine in detail the charts, important support and resistance levels.
ApeCoin Chart Analysis
ApeCoin shows an interesting formation on the four-hour chart, which is an ascending channel. This formation has created an important structure with touches to support and resistance lines and has enabled investors in the futures market to implement a serious strategy. With the recent developments, APE has managed to make its investors happy by breaking the resistance in its formation structure with the rise that started on November 25.
The most important support levels to watch for APE on the four-hour chart are respectively $1.682, $1.644, and $1.608. Especially, if the four-hour bar closes below the $1.682 level, APE will enter the formation zone and lose its upward momentum.
The most important resistance levels to watch for APE on the four-hour chart are respectively $1.752, $1.801, and $1.847. In particular, if the four-hour bar closes above the $1.752 level, APE price will gain momentum.
Blur Chart Analysis
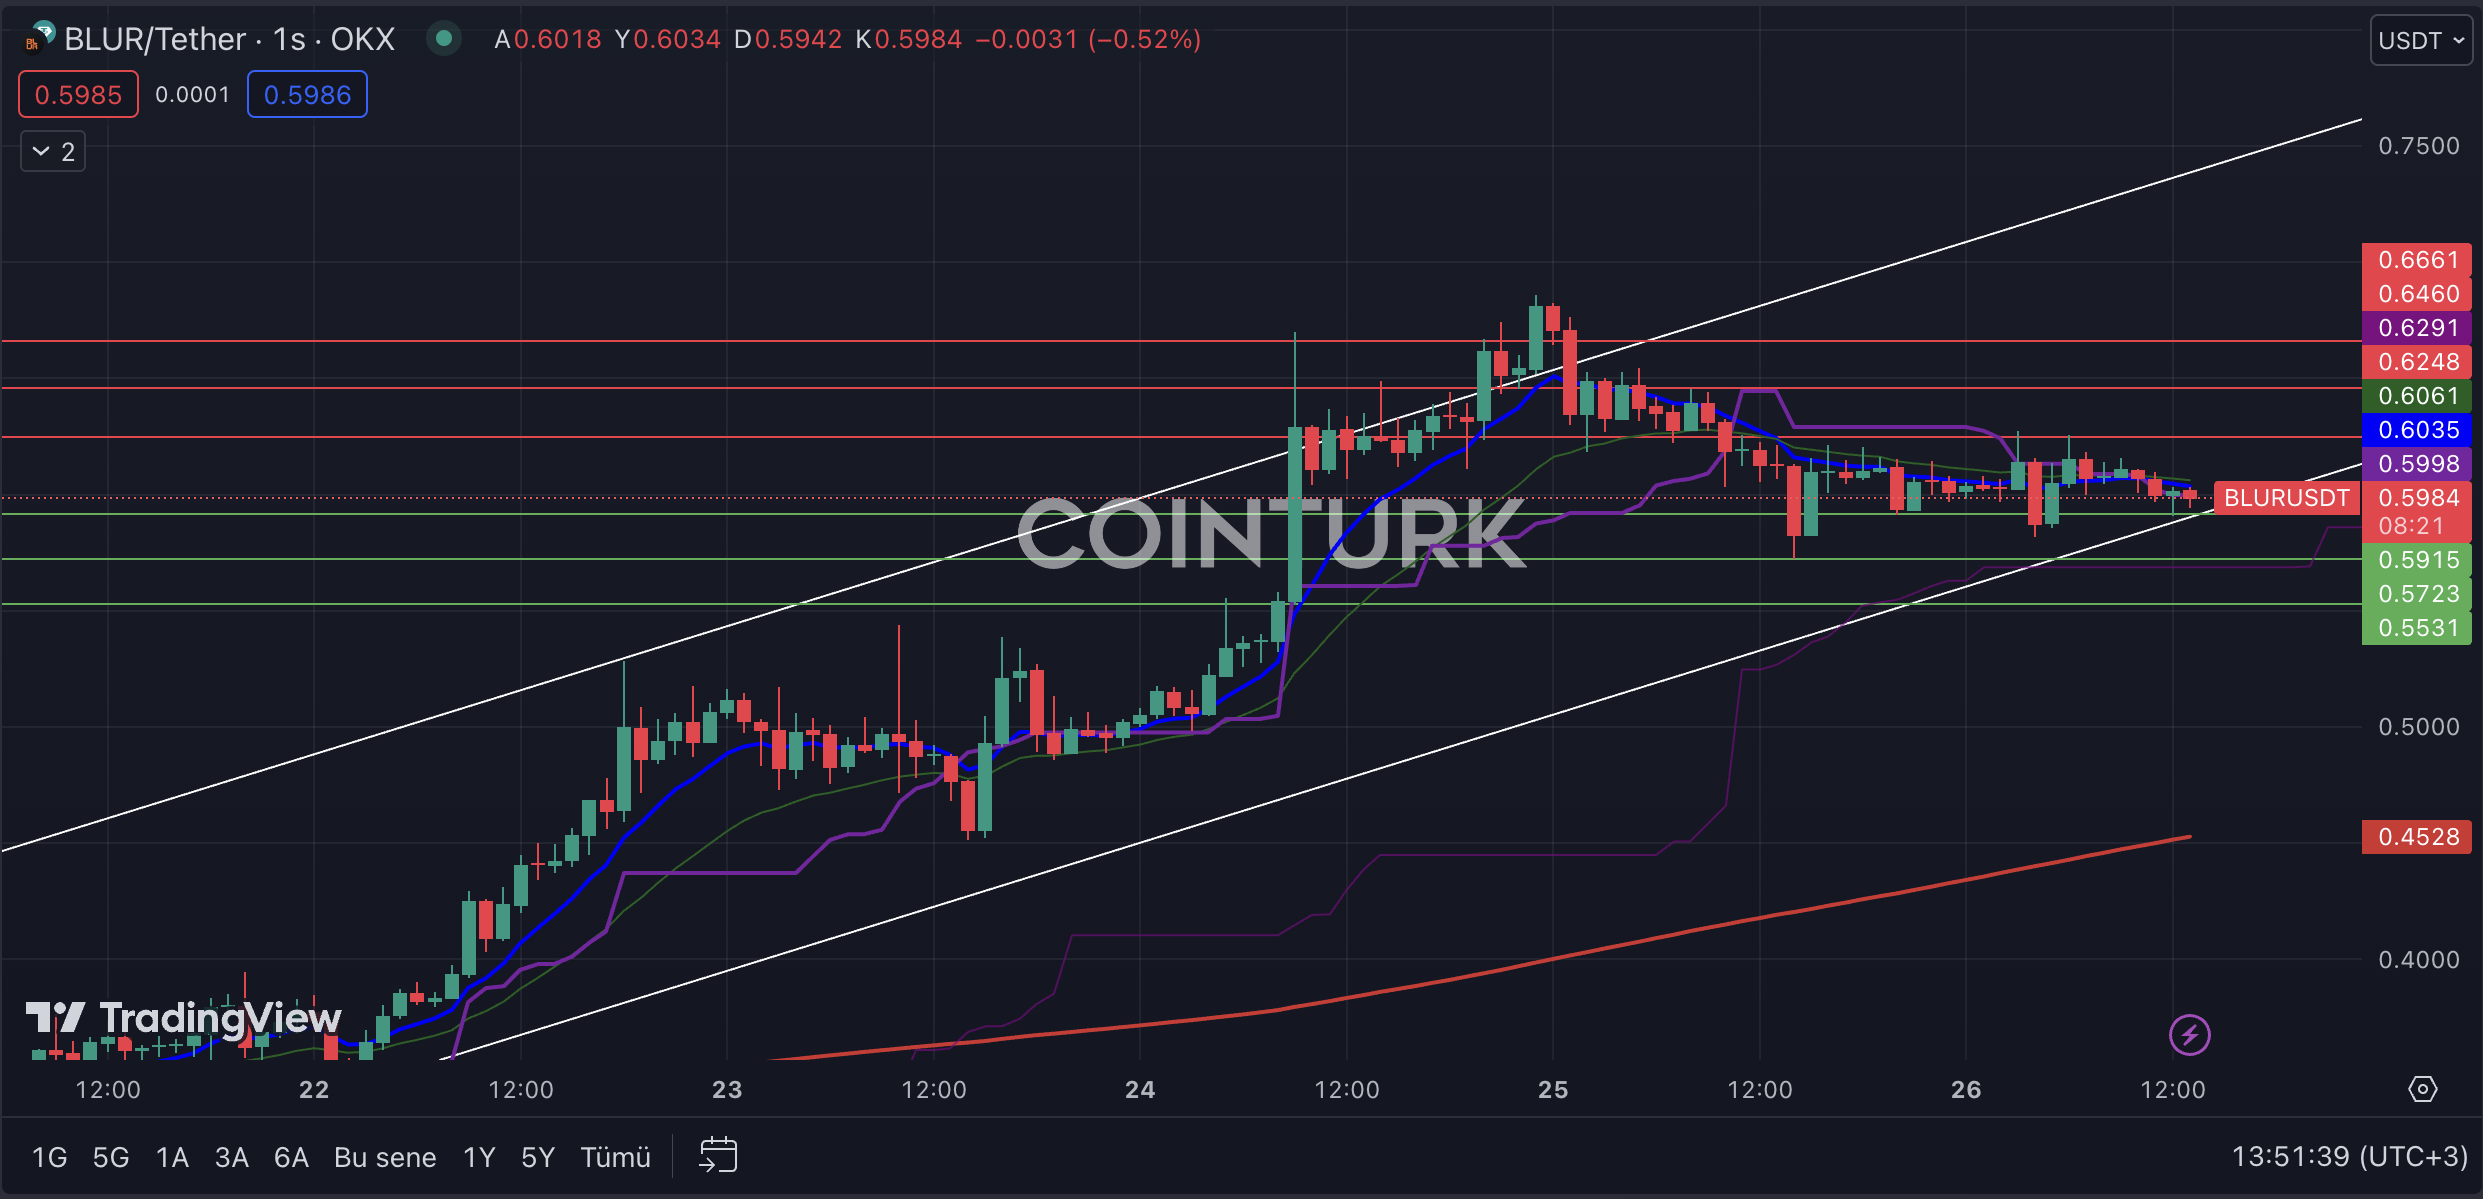
The BLUR team, which has recently made a name for itself with its successful projects and allocated 200 million tokens as the 2nd season airdrop reward for users, continues to move forward confidently. On the hourly chart, there is an ascending channel formation that has touched the support line with the recent bar closings, signaling a short-term process for the BLUR price.
The most important support levels to watch for BLUR on the hourly chart are respectively $0.5915, $0.5723, and $0.5531. Especially, if the hourly bar closes below the $0.5915 level, the formation structure will be disrupted and selling pressure will occur in the short term.
The most important resistance levels to watch for BLUR on the hourly chart are respectively $0.6248, $0.6460, and $0.6661. In particular, the first step for BLUR, which has been consolidating in a narrow range in recent bar formations, is for the bar to close above the $0.6248 level to gain momentum in the short term.

Read the full article here

