Although the trading volume of the entire crypto market dropped by 20% last week, some altcoin prices jumped, Santiment observed in a post. The post, dated February 5, noted that the attention shifted to cryptos including Flare (FLR), Ronin (RON), Chainlink (LINK), Bittensor (TAO), and Render (RNDR).
As a result, the prices of these altcoins climbed by double-digits. But Bitcoin (BTC) could not relate as the coin price only increased slightly.
📊 #Crypto market caps have edged up +0.5% over the past week, despite trading volumes dropping off -20.3% compared to the week prior. Highlight assets have included $FLR, $RON, $LINK, $TAO, and $RNDR. #Bitcoin continues seeing less attention as eyes turn to pumping #altcoins. pic.twitter.com/jMvJSTdV7c
— Santiment (@santimentfeed) February 5, 2024
Situations like this suggest that the altcoins might be gearing up for another pump. As such, traders might need to keep an eye out.
Flare (FLR) Price Analysis
FLR’s price at press time was $0.031, representing a 12.52% increase in the last 24 hours. Initially, the 4-hour FLR/USD chart showed that the price hit $0.034 before it faced a quick rejection to $0.030.
But with a return to $0.031, FLR could target the higher price once more. The earlier resistance could be linked to the fact the FLR was overbought. As of then, the RSI reading hit 78.30. But the indicator was back to 69.22 at press time.
Should buying pressure increase, FLR’s price could set to climb to $0.035. In a highly bearish case, the token value could drop to $0.025 where there was a lot of demand for the cryptocurrency.
FLR/USD 4-Hour Chart (Source: TradingView)
However, indications from the Awesome Oscillator (AO) showed that a notable decline could be avoided. This was because the AO was high at 0.006, suggesting increasing upward momentum.
Ronin (RON) Price Analysis
From the 4-hour chart, RON’s market structure was largely bullish. At press time, RON’s price was $3.46, indicating that the value had jumped by 89.59% in the last 30 days.
Furthermore, the Bollinger Bands (BB) showed high volatility. This indicates that price fluctuations for RON could be intense over the coming days. However, the upper band of the BB hit RON’s price at $3.46, suggesting that the token might be overbought.
Therefore, it is possible to see RON drop to $3.05 in the short term. In addition, the MACD was positive, indicating a bullish momentum. But the 12 EMA (blue) and 26 EMA (orange) were moving in the same direction. This implies that while buying pressure increased, profit-taking also followed.
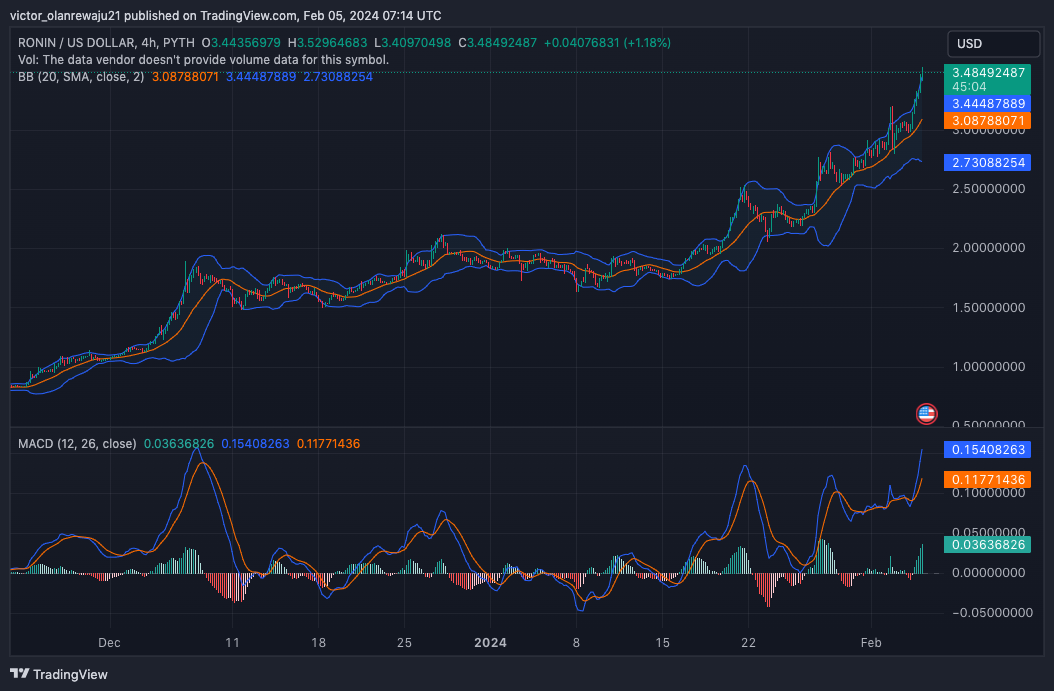
RON/USD 4-Hour Chart (Source: TradingView)
For the time being, RON’s price might fall. But it is unlikely that it will drop below $3. At the same time, the token value might rise higher than it has if profit-taking stops.
Chainlink (LINK) Price Analysis
A few days back, Coin Edition reported how LINK eyed a move to $20. Although the price has not yet hit the level, the token was able to close in on $19.
At press time, the On Balance Volume (OBV) has been increasing since January 31. The OBV shows crowd sentiment, suggesting that LINK has shown signs of a bullish outcome earlier. Should the OBV reading continue to rise, then LINK’s price might have no other option than to surge to $20.
However, there is a chance that LINK might retrace before the move. If this happens, LINK might drop to $17.80. Should this be the case, it could be another buying opportunity for those who missed out on the first run.
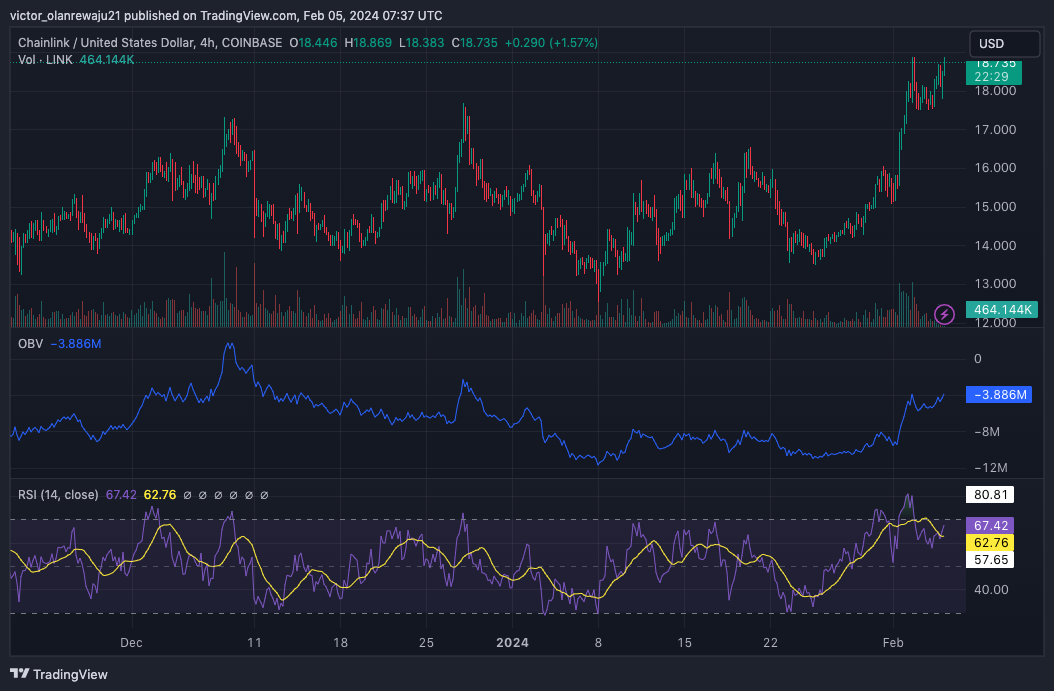
LINK/USD 4-Hour Chart (Source: Santiment)
The RSI also supported the projection as it also climbed. However, if LINK eventually hits $20, it could flash a sell signal. Thus, traders might need to approach with caution.
Bittensor (TAO) Price Analysis
TAO’s price hit $480 on February 1. But at press time, the value had dropped to $433.74, indicating that some traders had booked profits from the token.
However, signals from the Exponential Moving Average (EMA) that the price might rebound. At the time of writing, the 9 EMA (blue) on the 4-hour was above the 20 EMA (yellow).
Also, the TAO’s price was above the EMAs, suggesting that the trend was bullish. As it stands, TAO could head back to $480 or higher in the coming days.
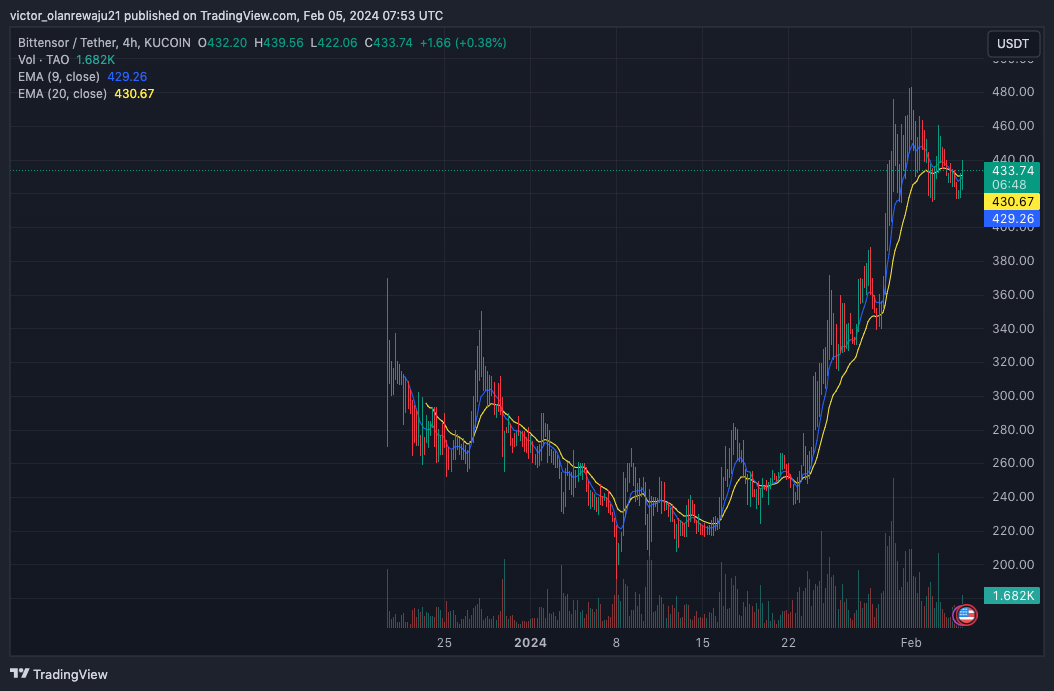
TAO/USDT 4-Hour Chart (Source: TradingView)
Render (RNDR) Price Analysis
For RNDR, its price increased by 10.50% in the last seven days. The increase pushed RNDR’s price above $5. However, the value had dropped to $4.48 as displayed on the 4-hour RNDR/USD chart.
In a highly bearish case, RNDR might drop below $4.28 which was the next support level. Also, an increase in selling pressure might pull RNDR down to $4.
A look at the RSI showed that the reading had dropped below 50.00, suggesting an increase in the presence of sellers. Furthermore, the Money Flow Index (MFI) also decreased. The reading indicated that buyers’ dominance was almost non-existent.
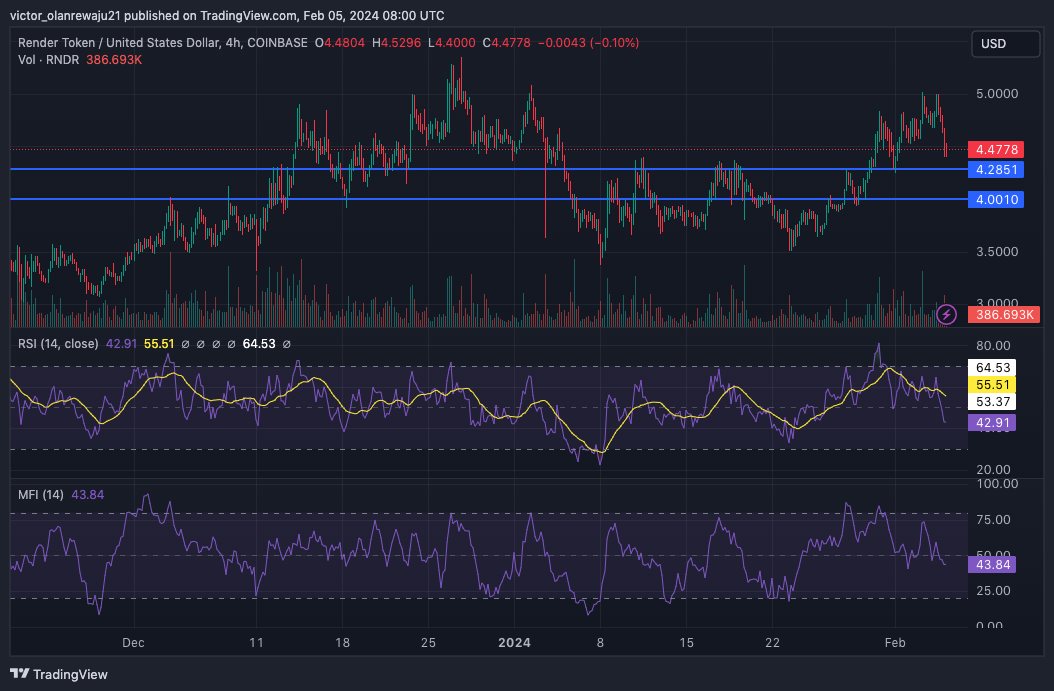
RNDR/USD 4-Hour Chart (Source: TradingView)
Should the MFI fall below 20.00, RNDR would be deemed oversold. In this instance, the price might bounce and possibly target a new high.
Bitcoin (BTC) Price Analysis
Over the last few days, BTC has been exchanging hands between $42,313 and $43,792. This tight trading range confirms how liquidity was rotating into other coins and not BTC.
However, the RSI had climbed to 55.15, suggesting that the price could move above $43,000. But the potential jump does not mean that BTC would move to $50,000 in the short term.
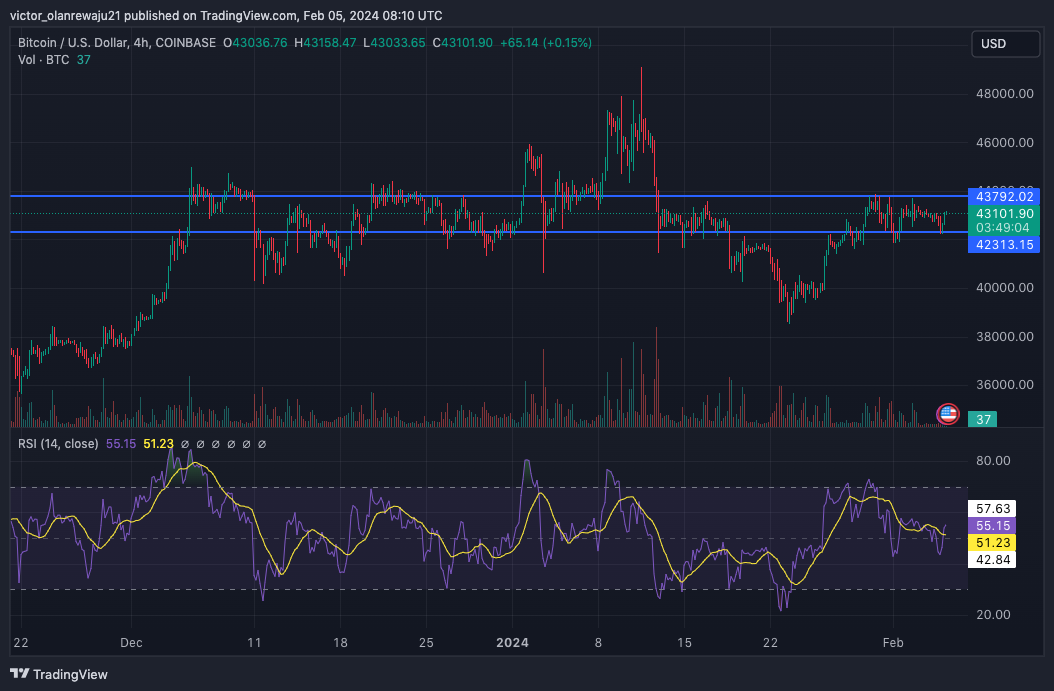
BTC/USD 4-Hour Chart (Source: TradingView)
If liquidity continues to flow out of Bitcoin, the price increase might only last for a short while. But there is a high chance that the price continues to trade above $40,000.
Disclaimer: The information presented in this article is for informational and educational purposes only. The article does not constitute financial advice or advice of any kind. Coin Edition is not responsible for any losses incurred as a result of the utilization of content, products, or services mentioned. Readers are advised to exercise caution before taking any action related to the company.
Read the full article here

