
Crypto Market Analysis: This week marked a bullish phase for the cryptocurrency market, with a significant resurgence in buying interest across most major cryptocurrencies. Bitcoin, the leading digital asset, experienced an 11% increase, climbing from $42,279 to $46,937. This rally, coupled with the rising inflow into Bitcoin ETFs, underscores the growing market interest in Bitcoin (BTC) as the underlying asset, thereby reinforcing a wider optimistic outlook in the market.
The total cryptocurrency market cap is making a pivotal move by breaking above a critical red resistance zone, as noted by crypto trader @rektcapital. A weekly close above this area could mark a significant bullish shift, turning resistance into support and potentially leading to further market growth.
This event signals a possible recovery phase, encouraging investors to monitor the market for opportunities as it may indicate the start of an expansive upward trend.
Total #Crypto Market Cap is breaking above the red resistance area
A Weekly Candle Close above this red area could set up for a retest of it into new support before expansion to the upside#BTC #Bitcoin https://t.co/ZFa0zRM9aN pic.twitter.com/xxz6vZuYKP
— Rekt Capital (@rektcapital) February 9, 2024
Amid the renewed recovery, Bitcoin (BTC), ImmutableX (IMX), and SUI showcase aggressive bullish momentum and potential for higher growth.
Is Bitcoin (BTC) Price Heading Back to $49000?
Bitcoin (BTC) Price| Tradingview
On February 7th, the Bitcoin price gave a decisive breakout from the resistance trendline of a pennant pattern. This bullish continuation pattern releases the build-up bullish momentum and surges the price by 8% in the last 4 days.
Under the influence of this pattern, the BTC is likely to rise another 4% by mid-February and rechallenge to a yearly high of $49000.
Historical data reveals a fascinating trend in Bitcoin’s performance, with February and October emerging as the standout months for potential gains. According to insights shared by the esteemed crypto analyst @IT_Tech_PL, these months have consistently delivered positive returns for Bitcoin, with only two exceptions throughout its history.
Such a pattern underscores the unique seasonal tendencies within the cryptocurrency market, suggesting that these periods may offer favorable conditions for $BTC investors.
Bitcoin Monthly Returns:
Historically, February and October have been the best months for Bitcoin. Only twice in the entire history of $BTC’s existence has it resulted in an average loss in these months. While it’s known that past results do not guarantee future profits, I am… pic.twitter.com/q19kkTKNZZ
— IT Tech (@IT_Tech_PL) February 9, 2024
While past performance doesn’t guarantee future results, it may give higher conviction for long-position traders.
Renewed Recovery Sets ImmutableX (IMX) Price For Rally Beyond $2.84
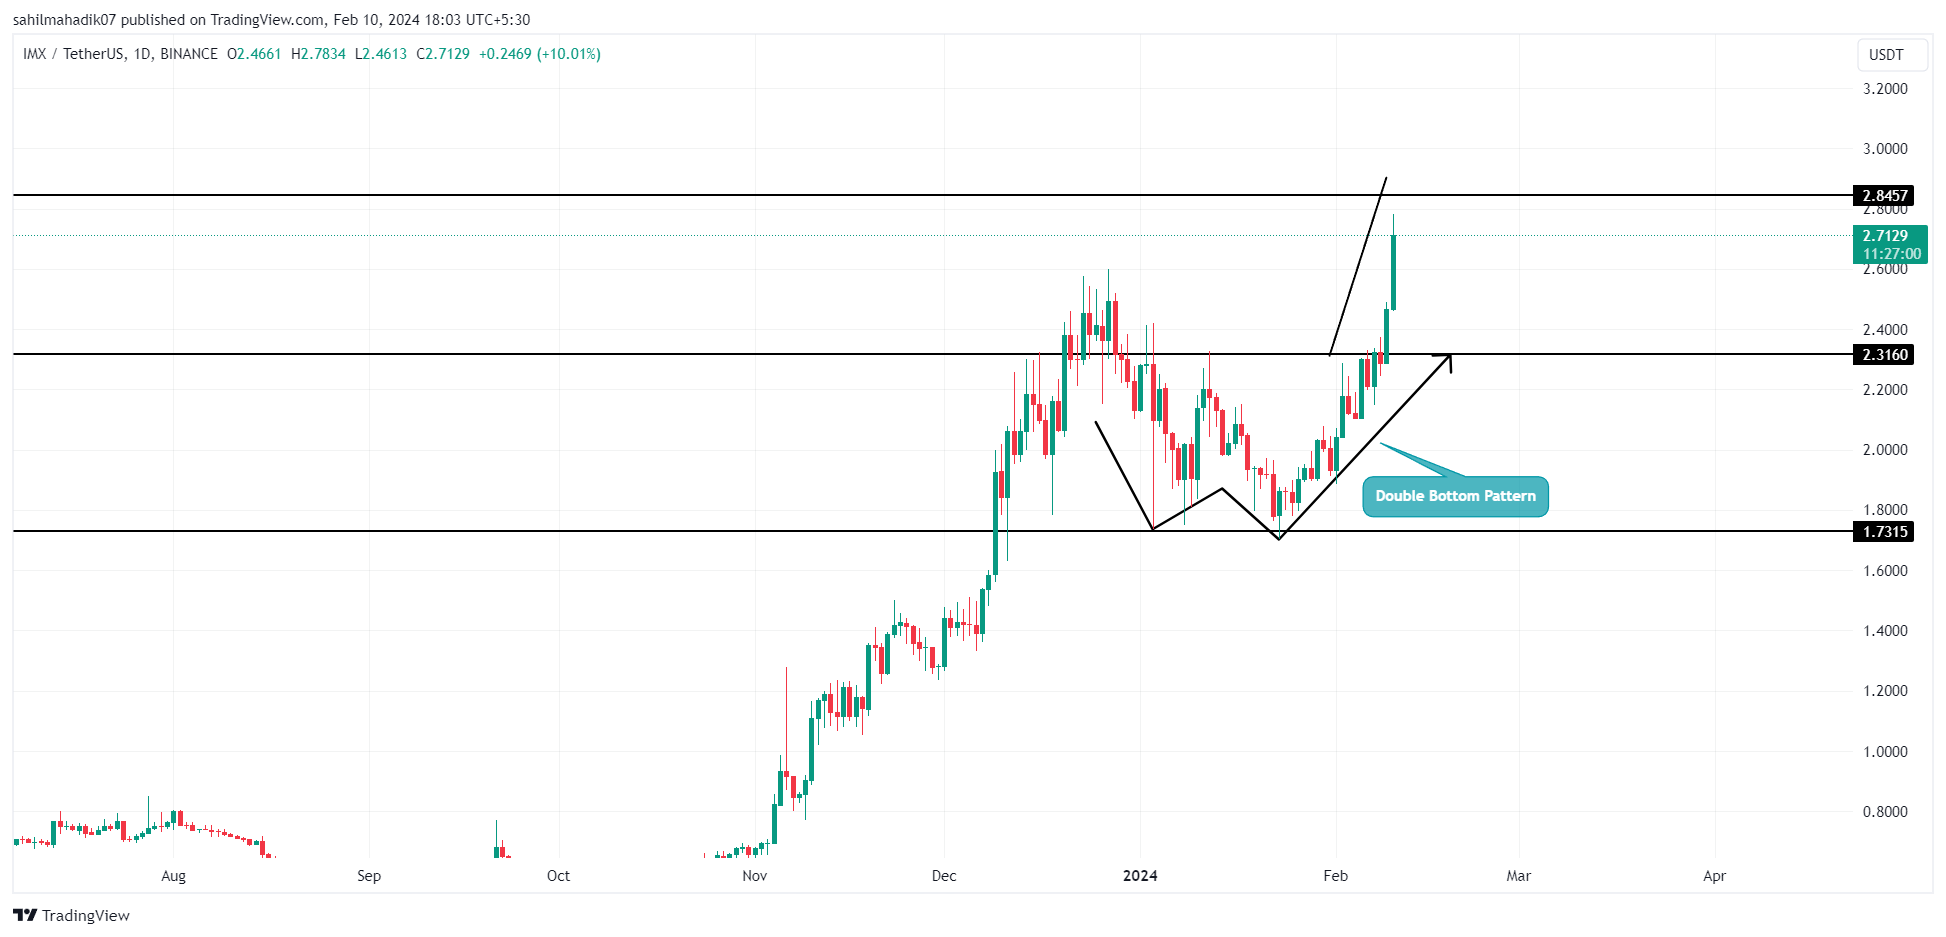
ImmutableX (IMX) Price| Tradingview
During the late January surge in the cryptocurrency market, ImmutableX (IMX) coin price demonstrated a bullish reversal, bouncing off a crucial support level at $1.75 and the 38.2% Fibonacci retracement mark. This shift propelled the coin’s value by 61% over three weeks, bringing its current trading price to $2.735.
This significant recovery is largely attributed to the announcement of the Immutable zkEVM Mainnet Early Access, an innovative venture in blockchain gaming powered by Polygon.
Immutable zkEVM Mainnet Early Access is live!
The future of gaming is here with the launch of Immutable zkEVM Mainnet, powered by @0xPolygon.
Immutable zkEVM is an ecosystem that empowers games to thrive. It offers massive scalability, smart contract compatibility, and gas-free… pic.twitter.com/zSrUOwnsQo
— Immutable (@Immutable) January 29, 2024
Should the current trend persist, the IMX price is poised for an additional 6% increase in the upcoming week, potentially breaking through the March 2022 high of $2.84. A successful push beyond this threshold could further fuel the buying momentum, marking an early indicator of a trend reversal.
Is SUI Price Ready to Hit $2?
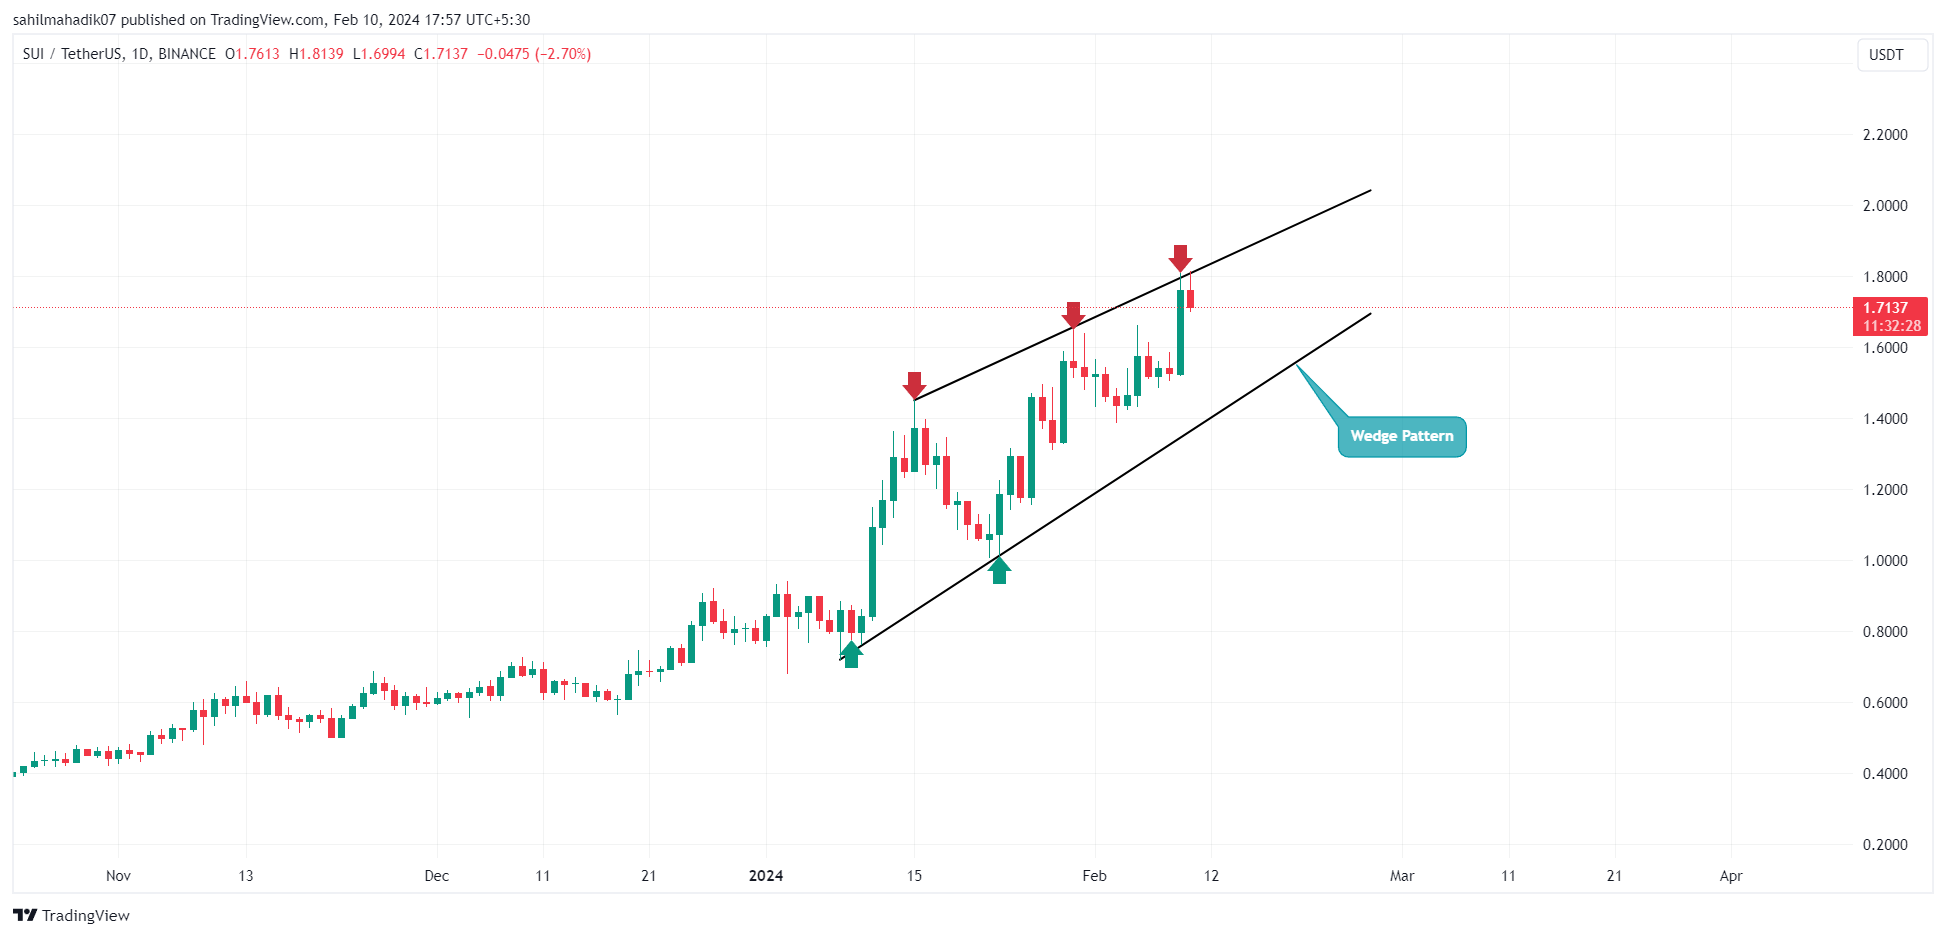
SUI Price| Tradingview
The SUI price has experienced consistent growth within a rising wedge pattern on the daily chart, climbing from $0.72 to $1.71, a notable 138% increase. Despite a 2.48% loss in intraday trading, the price’s reversal from the upper edge of the pattern indicates a potential pullback towards the lower trendline.
This movement could offer a buying opportunity, with the price poised to reach $2 in the next upward move. Nonetheless, for the SUI coin to embark on a more definitive trend, it needs to break through the wedge pattern’s boundaries.
Related Articles:
- 5 Underrated Crypto To Buy For 2024 Bull Run: SUI, BTC, MANTA, DMY, ETH
- Crypto Prices Today: Bitcoin Nears $46K, Pepe Coin Continues Rebound & DYM Surges 30%
- Experts Forecast Ethereum Price Surge to $19,190 by 2030
Read the full article here