Chainlink (LINK) appears to have reaffirmed its position above a newly found support at $10 after facing rejection from $12. The leading price feed oracle token has over the last few weeks stood out as one of the biggest bullish contenders, increasing by 45% in a month to trade at $11.20 on Friday.
Can Chainlink Keep The Uptrend Intact To 18?
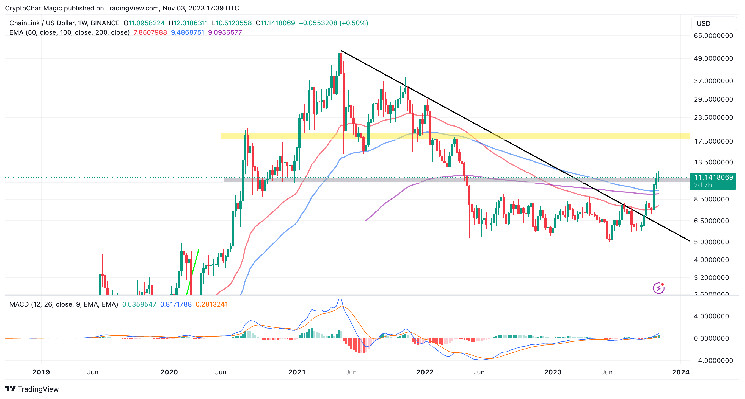
The weekly chart shows Chainlink price trading above all the bull market indicators starting with the 50-day Exponential Moving Average (EMA) (red), the 100-day EMA (blue), and the 200-day EMA (purple).
Support above the grey zone as illustrated on the chart is expected to be the springboard that boosts LINK above the immediate resistance at $12.
The Moving Average Convergence Divergence (MACD) indicator’s position above the neutral area calls upon traders to keep seeking exposure to LINK longs. In addition to the buy signal which manifested with the blue MACD line crossing above the red signal line, green histograms reinforce the bullish outlook.
Based on the On-Balance Volume (OBV) traders have a strong bullish conviction and are willing to bet on a continued Chainlink rally.
Chainlink price prediction chart | Tradingview
With the expected break above $12 materializing, LINK would be in a suitable spot to rally to $18. However, profit-booking can start at $14.5 with extremely bullish traders waiting on the uptrend to play out to $18.
Meanwhile, declines below Chainlink’s immediate support at $10 could see the Oracle token. Sweep liquidity at $7.5, the local support. However, it is important to realize that all three moving averages are in line to prevent declines from wiping out the progress made over the last few weeks.
The Relative Strength Index (RSI) although currently in the overbought region and depicting a strong bullish trend, could signal a potential pullback if it slides into the neutral area.
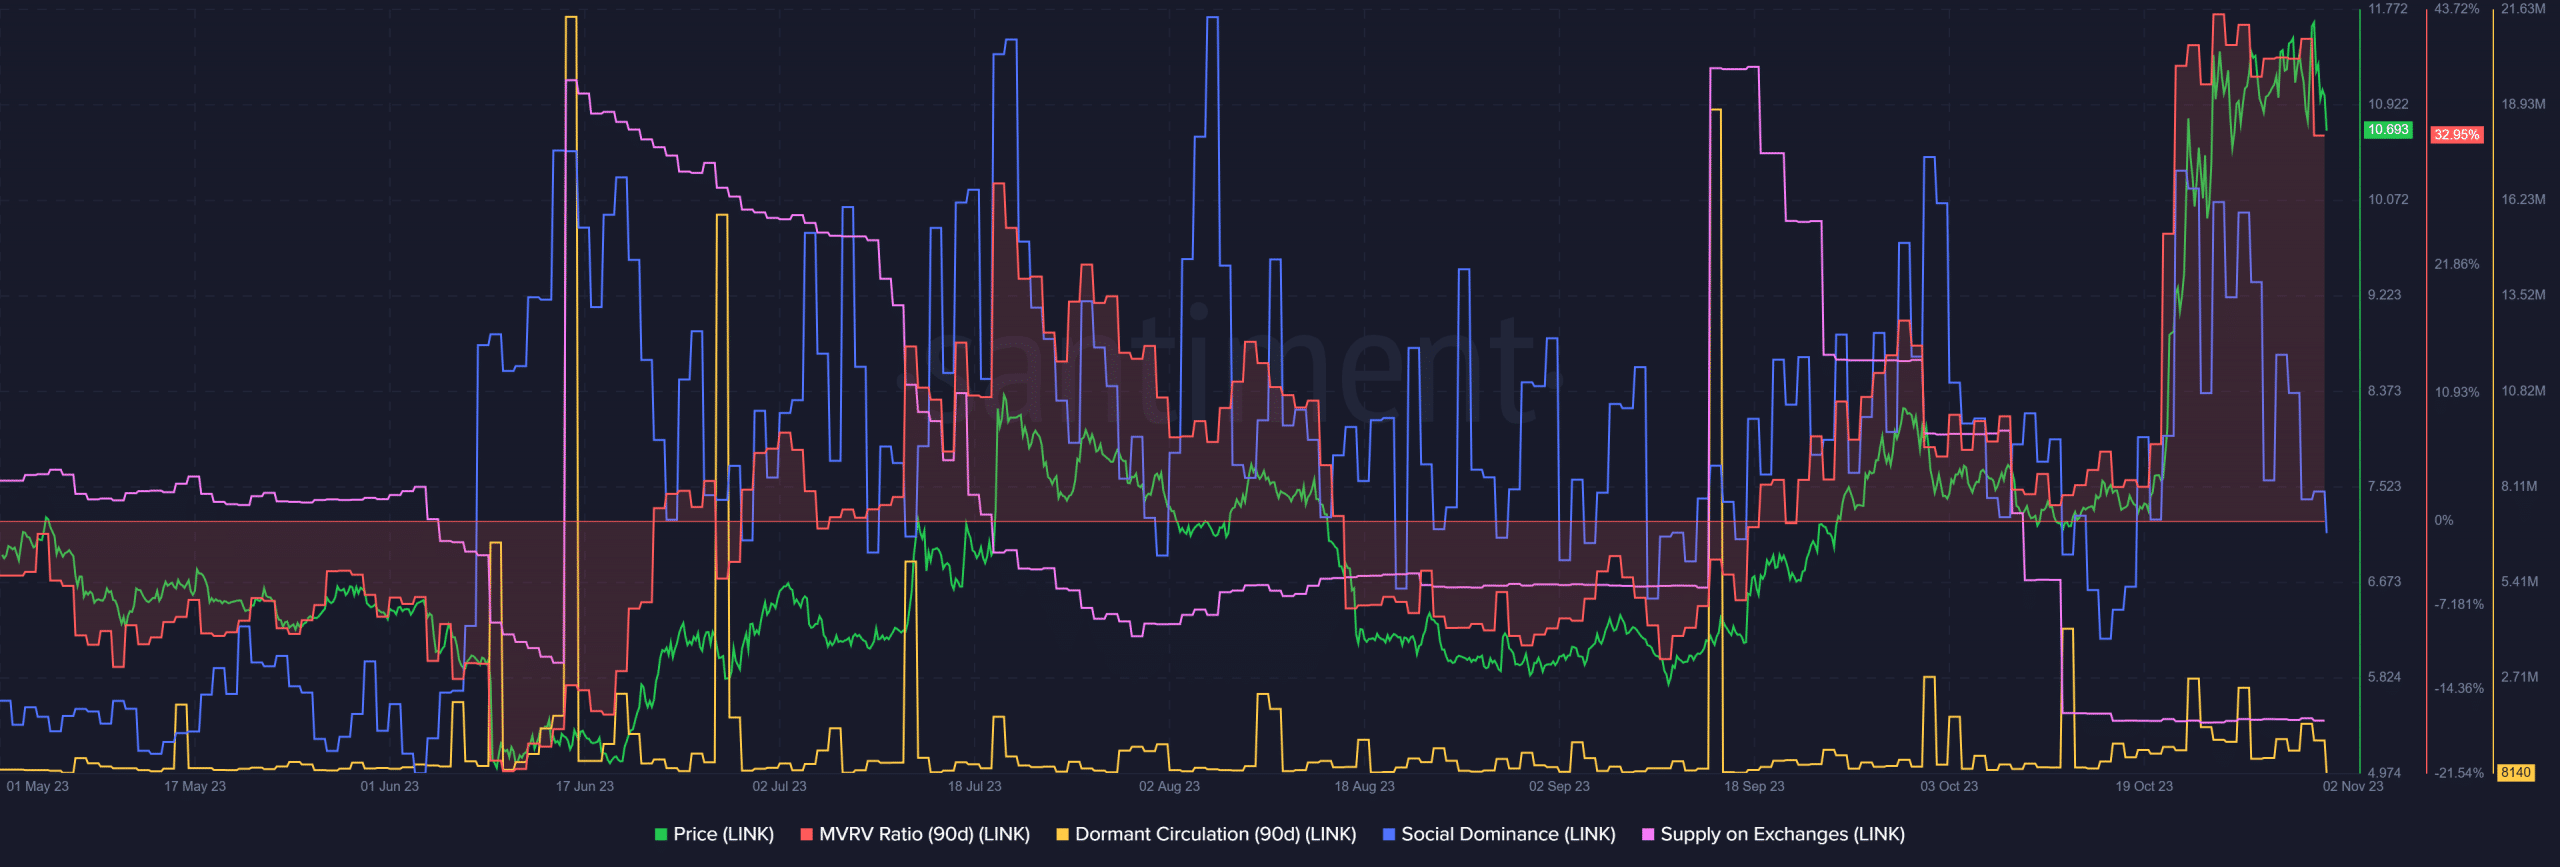
Fundamental data from blockchain analytics platform Santiment reveals that the supply of LINK on exchange has been relatively low, thus reducing the potential for selling pressure.

Chainlink fundamentals | Santiment
Idle or Dorman supply has remained relatively quiet implying that long-term holders are willing to keep holding Chainlink despite the increase in value. However, a higher MVRV ratio reflects that most holders are in profit relative to when they bought LINK. This is not a bullish sign for LINK as it suggests a possible increase in selling pressure.
Related News
- Breaking: US Treasury Cracks Down on Russian Money Laundering Queenpin
- US Seizes $54 Mln Crypto, Including Ethereum, In Narcotics Scheme
- Cardano (ADA) Defies Broader Market Correction Amid Whale Transactions, What’s Next?
Read the full article here

