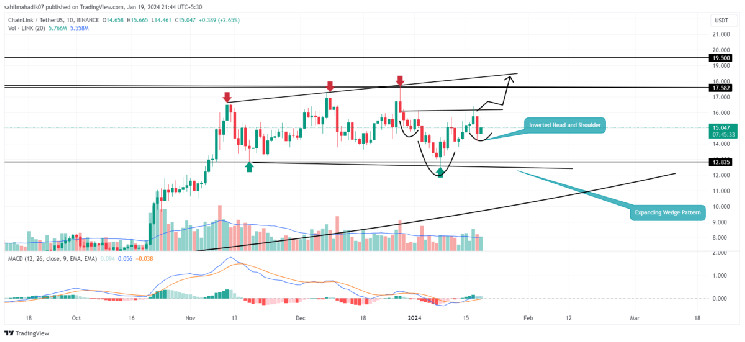
The 14th largest cryptocurrency by market cap, Chainlink has made a quick recovery from the crypto market sell-off on Thursday. While the BTC price plunged below $42000 and major altcoin prolonged their correction, the LINK price showcased sustainability above $14.2. With an intraday gain of 5%, the coin price is developing a bullish reversal pattern called an inverted head and shoulder pattern. Will the renowned buying pressure surge the Chainlink price past the $20 mark?
Head & Shoulder Pattern Sets 15% Surge Ahead
- Expanding channel pattern breakout will assist LINK to escape market uncertainty.
- The flattish 20-and-50- EMAs accentuate a short-term sideways trend
- The intraday trading volume in the LINK coin is $745 Million, indicating a 41% gain.
Chainlink Price TradingView Chart
Wavering on the market sentiment around the Bitcoin ETF launch, the Chainlink price has been traveling a sideways trend for the past two months. The coin price formed a notable price swing but no conviction of more buyers or sellers created indecisiveness among traders.
A look at the daily time frame chart shows the price swing when connecting through two trendlines indicating a widely known chart pattern called an expanding channel. This pattern formed during market uncertainty guides the price behavior resonating between two trendlines, before giving a decisive breakout.
On January 8th, the coin price witnessed its latest reversal from the pattern lower trendline to trigger a 30% upswing and hit $16.39. Amid the market sell-off yesterday, the LINK price witnessed a 7% drop but managed to hold ground above $14.2.
In a recent development tracked by IntoTheBlock, a significant move was observed in the $LINK market. Following a price dip, a whale investor seized the opportunity, investing $8.9 million to acquire 601,949 $LINK, each priced at $14.81. This substantial purchase was distributed across three new wallets, indicating a strong confidence in $LINK’s value.
Is Chainlink Price Ready For Uptrend?
With the renewed buying interest, the LINK price is 5% up and developing an inverted head and shoulder pattern. This bullish reversal pattern reflects a shift in market dynamics and an opportunity for buyers to lead significant recovery.
Currently trading at $15.2, the Chainlink price should breach the neckline resistance at $16.2. A potential breakout would bolster prolonged recovery to 15% to hit channel pattern resistance at $18.5.
A breakout above this barrier is needed to get better confirmation of sustained uptrend
- Experimental Moving Average: The LINK price suitability above 100-day EMA indicates the overall trend remains bullish
- Moving Average Convergence Divergence. A bullish crossover between MACD(blue) and signal(orange) reflects the recovery sentiment returning to the market.
Read the full article here

