
The struggle of Bitcoin to surpass the $38,000 resistance level has affected the altcoin market, including Shiba Inu (SHIB). SHIB, a popular meme coin that was launched in August 2020 and quickly skyrocketed by an unbelievable 10 million percent, creating dozens of new millionaires, recently formed a local peak at $0.00000965 and is currently consolidating within two converging trend lines since last week. This formation indicates a potential breakout of the $0.00001 barrier for SHIB, potentially helping it reach new highs.
Shiba Inu Price Analysis
In the past 30 days, the price of Shiba Inu has experienced significant growth, rising from $0.00000612 to the current trading price of $0.00000863, representing a 30% increase. However, this upward trend encountered resistance around the $0.00000965 level, coinciding with a period of increased uncertainty in the market.
This led to a temporary pullback, reaching a level of $0.000008, which corresponds to the 50% Fibonacci retracement level. In the context of a long-term bull run, this pullback is generally seen as a healthy correction.
When examining the 4-hour timeframe chart, it can be observed that this consolidation phase has formed a continuation pattern known as a “flag.” Typically, this formation involves a brief period of horizontal movement before a definitive upward breakout. If SHIB breaks above the upper trend line of this flag formation, it could potentially target $0.0000150 as the initial price objective, representing an 18% potential gain.
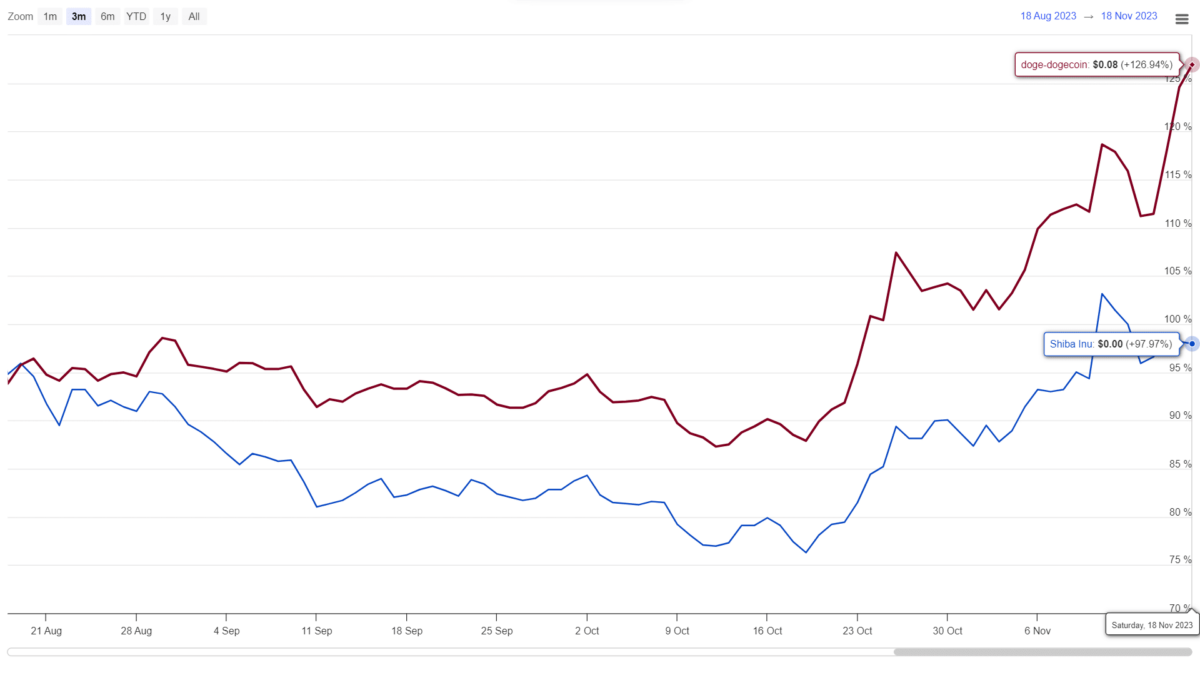
Comparison of SHIB and DOGE Performance
When comparing the price behavior of SHIB with its main competitor, Dogecoin (DOGE), over the past three months, it can be seen that DOGE has shown stronger momentum, consistently forming new highs and lows. On the other hand, SHIB is struggling to surpass the $0.00000969 level. Considering the prevailing bullish trend in the market, Dogecoin may offer more favorable opportunities for long positions.
Meanwhile, SHIB is forming declining lows on the daily timeframe’s Relative Strength Index (RSI), indicating selling pressure. However, the ongoing upward trend in SHIB’s price suggests a higher probability of further upward movement. The converging Bollinger Bands (BB) along with RSI indicate that the market is currently in a typical correction phase before a potential breakout or continuation of the trend.
Read the full article here