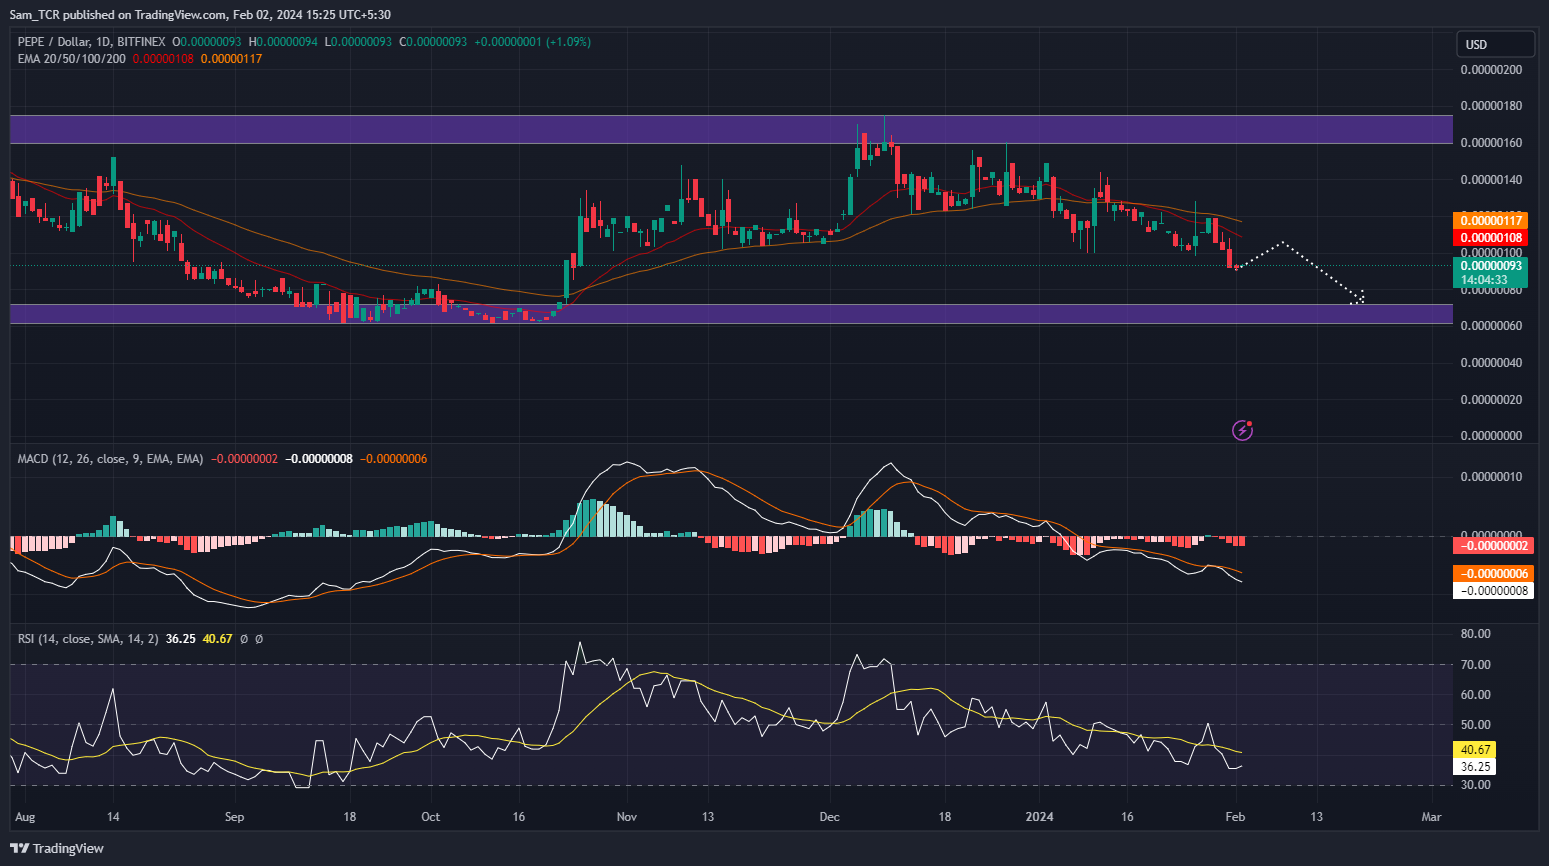
- 1 The PEPE price action highlights a bearish view at the time of publishing, as it recently slumped from a pivotal supply level.
- 2 Trend analysis of the PEPE chart highlights bearishness and suggests that it could drop further.
The PEPE crypto asset is showing confirmed bearishness as it drops below the 20, and 50 Day-EMA bands.
The price action shows that the price soared from $0.00000070 to $0.00000175 in the past. PEPE price fell from the supply level of around $0.00000175 on the chart.
The PEPE crypto plunged and could be on the brink of dropping further, as it faces the resistance level and makes lows breaking previous swing low points in the process, making it as a seamlesss downtrend fall. Price analysis shows that PEPE crypto is in a bearish trend. Price fell last week, last month, and last quarter by 10.58%, 34.04%, and 12.26%, respectively.
The crypto is showing bearish features as MACD is at -0.0000008 and showing a bearish crossover. Meanwhile, the signal line is at -0.000000006 and the histogram difference between both the lines is -0.00000002.
PEPE Crypto Price Daily Chart Analysis
Source: PEPE/USD: BITFINEX.1.D. by TradingView
Moreover, the RSI is falling steadily, taking resistance from the 14-SMA, suggesting that the PEPE crypto asset is losing buyers. The sellers are dominating, new lows are expected soon. The RSI is at 36.25 and the 14-SMA smoothened line is at 40.67.

Source: PEPE/USD: BITFINEX.1.D. by TradingView
Furthermore, the crypto experienced a rise of 1.09% in the last 24 hours, and was trading at $0.00000093 at press time. The PEPE price is forming downward structures by facing strong resistance from negative trendline.
Therefore, if the PEPE crypto price fails to hold above the $0.00000070 level, it could crack the current support and fall to the next big support.
However, if the demand for the crypto and buying force increases, then the PEPE asset price could reverse from the current level. The next target for the PEPE price would be to reach $0.00000130.
Summary
PEPE price highlights the bearish sentiments and perspectives regarding the crypto asset in the daily time frame. The PEPE price action highlights a bearish view at the time of publishing, as it slumped from a pivotal supply level.
Technical indicators suggest the downtrend is likely to continue over the daily time frame chart. The RSI, and EMAs highlight bearish moves on the PEPE price chart.
Technical Levels
Support Levels: $0.00000070
Resistance Levels: $0.00000130.
Disclaimer
In this article, the views, and opinions stated by the author, or any people named are for informational purposes only, and they don’t establish the investment, financial, or any other advice. Trading or investing in cryptocurrency assets comes with a risk of financial loss.
Adarsh Singh
Adarsh Singh is a true connoisseur of Defi and Blockchain technologies, who left his job at a “Big 4” multinational finance firm to pursue crypto and NFT trading full-time. He has a strong background in finance, with MBA from a prestigious B-school. He delves deep into these innovative fields, unraveling their intricacies. Uncovering hidden gems, be it coins, tokens or NFTs, is his expertise. NFTs drive deep interest for him, and his creative analysis of NFTs opens up engaging narratives. He strives to bring decentralized digital assets accessible to the masses.
Read the full article here

