")
Things are not looking good for Ripple. XRP has been trending lower against USDT while also breaking below a key support level on the BTC pair.
Technical Analysis
By TradingRage
The USDT Paired Chart
Against USDT, XRP has been making lower highs and lows inside a large descending channel. Since breaking below the 200-day moving average (currently located around the $0.6 mark), there have been no signs of recovery.
The market seems more likely to drop toward the lower boundary of the channel in the coming weeks before a bullish reversal can be expected.
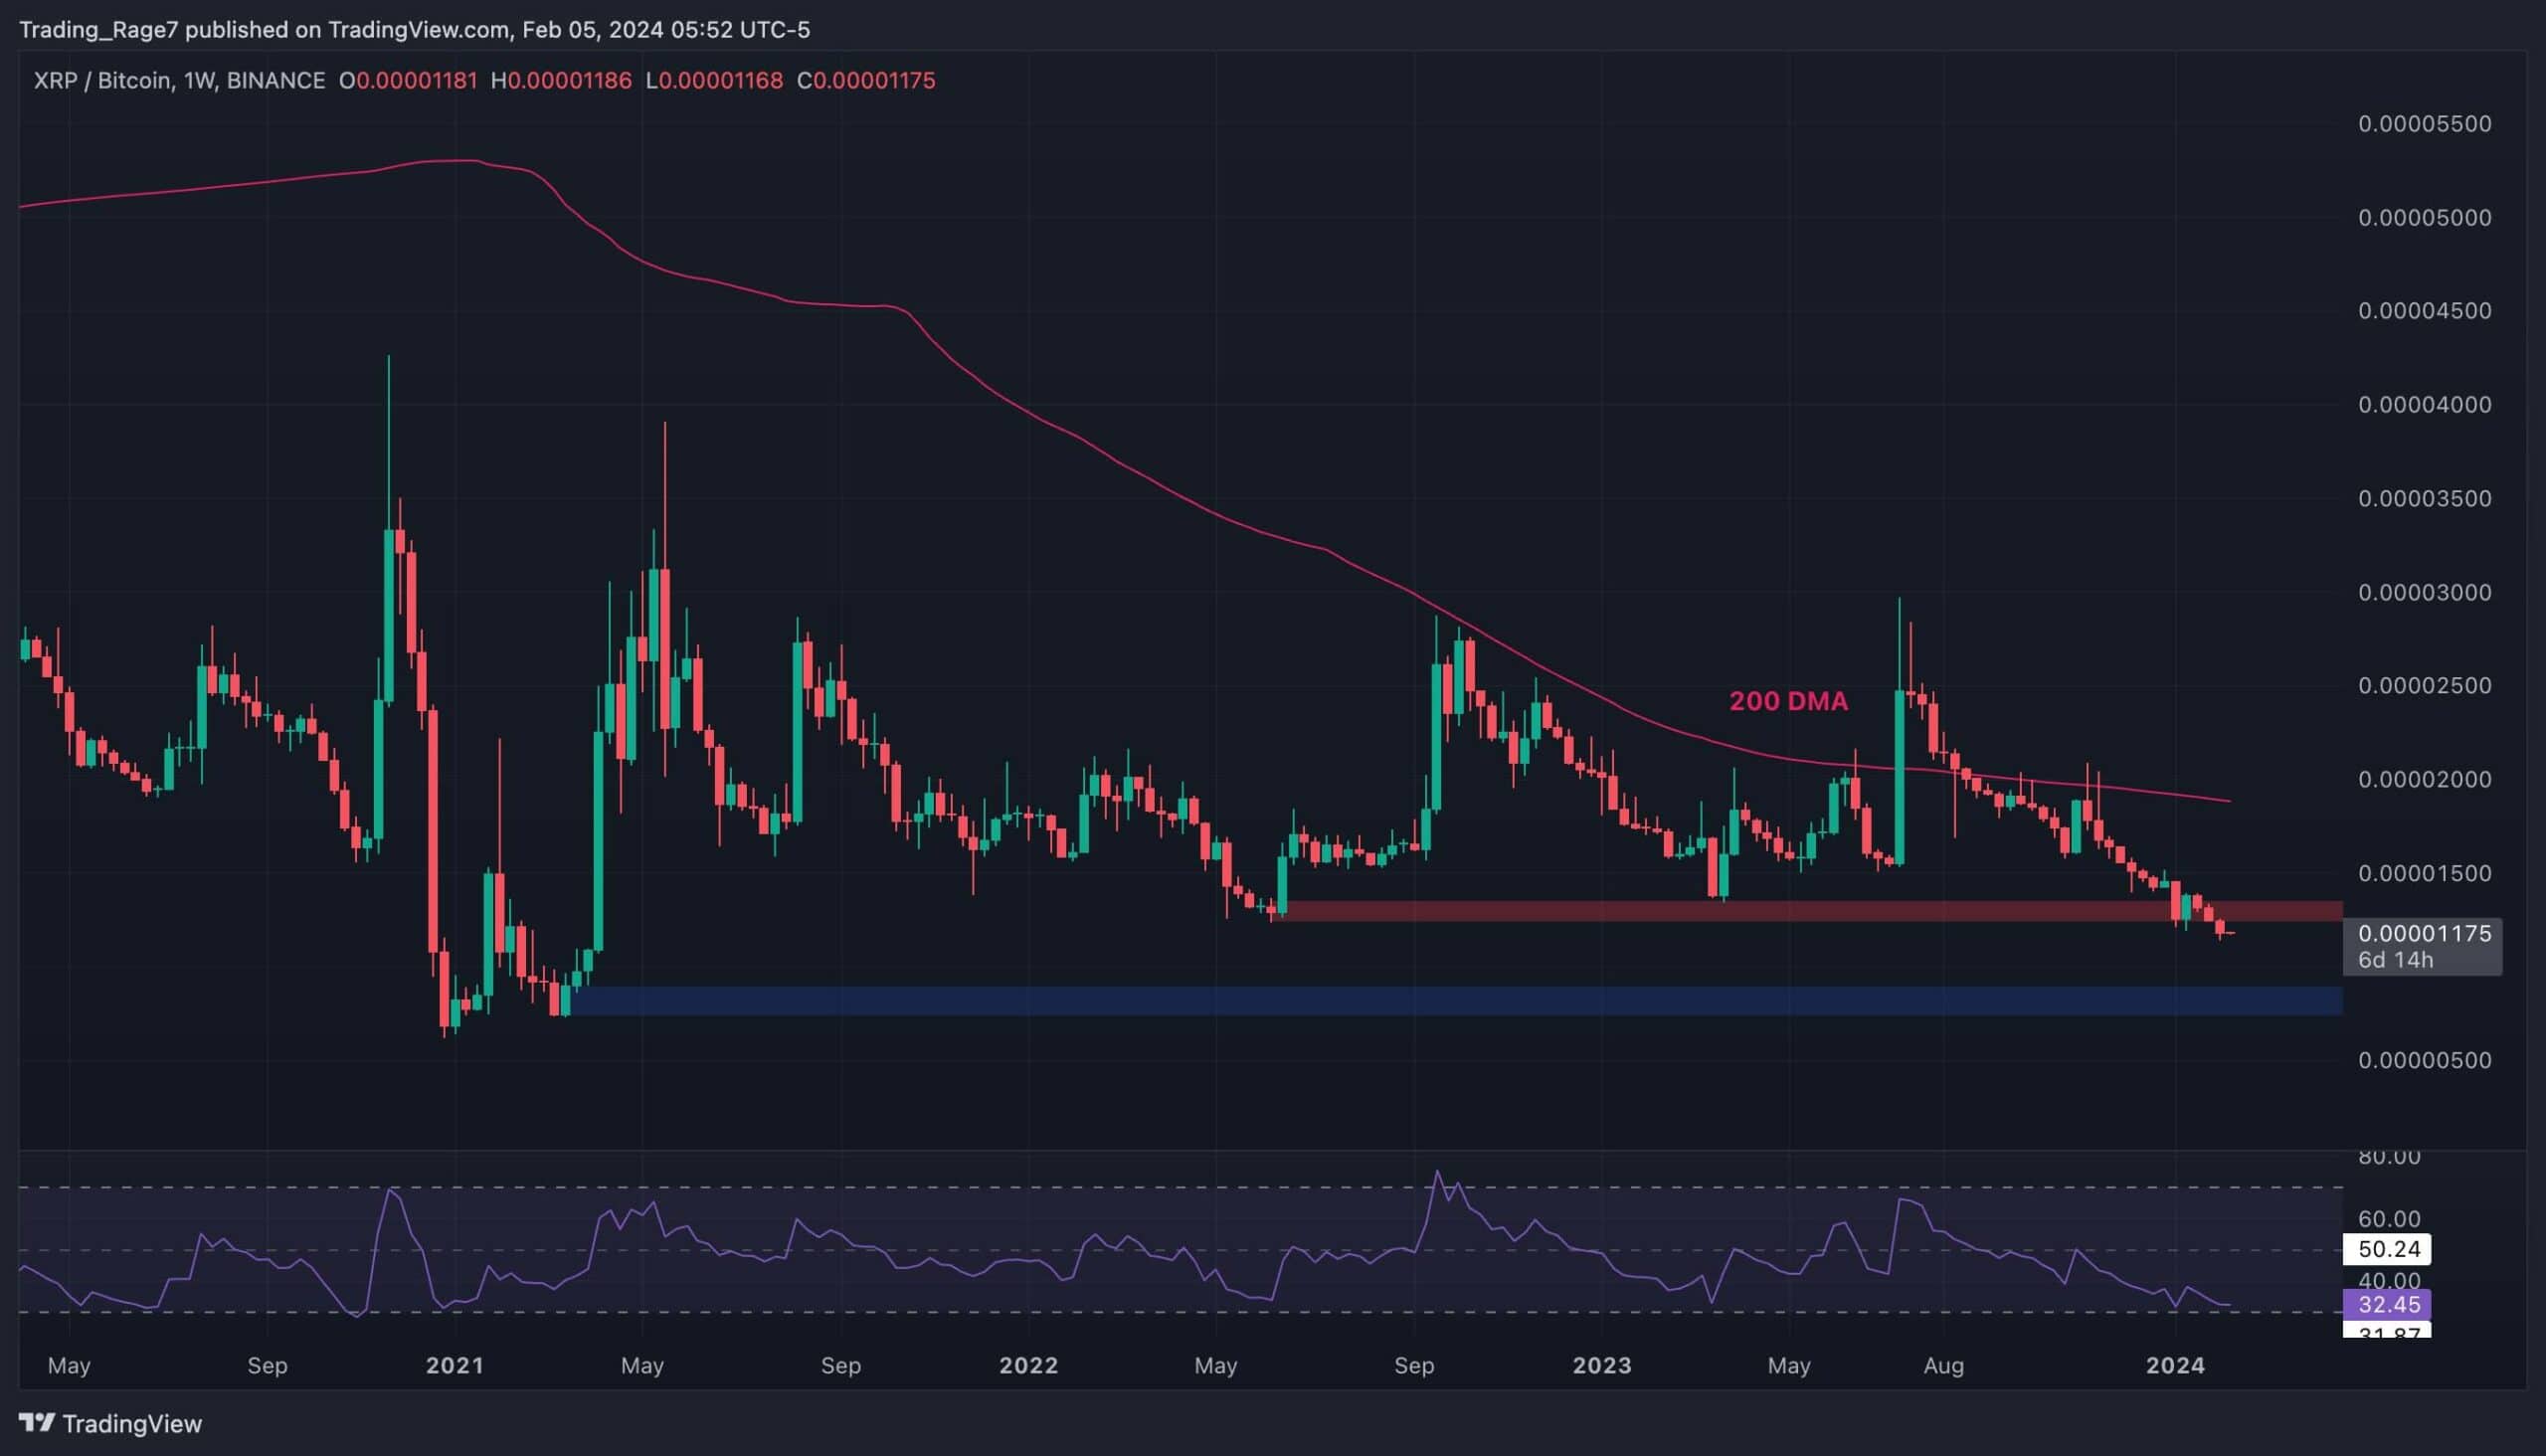
The BTC Paired Chart
On the weekly chart of the XRPBTC pair, things are looking even more worrisome. The cryptocurrency broke below the key 1200 SAT level last week. In case the market does not climb back above the mentioned level soon, the next potential target for the downtrend would be the 800 SAT support level.
With the Relative Strength Index showing values lower than 50%, the probability for further downside is looking considerable at the moment.
Read the full article here