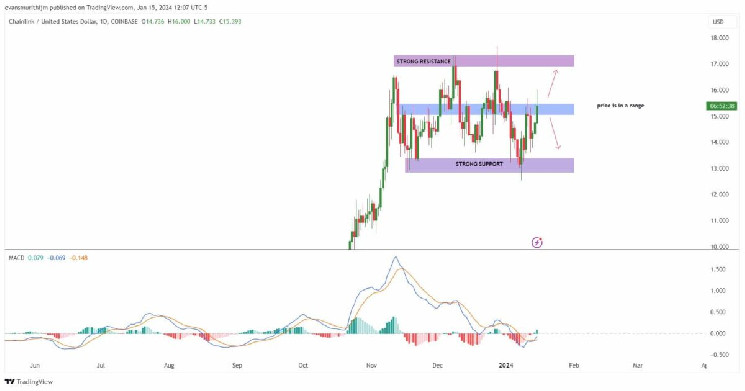
Chainlink price has shown notable trends in early 2024, consistently oscillating between $13 and $17 since November 8. This behavior signals a robust bullish trend, however, the asset faces bear resistance, mirroring the broader market’s volatility. This fluctuation underscores the unpredictability in the cryptocurrency realm as investors navigate through the challenging crypto scene.
Chainlink price has recently witnessed a significant upsurge, climbing over 4% in the past month. This increase results from the ongoing tussle between the market’s bears and bulls, akin to a financial tug-of-war. Currently, the bullish forces are gaining the upper hand. Over the last weekend, the cryptocurrency experienced a minor breakout, propelling its value to a two-week high of $15.86.
Chainlink Price Oscillation: Bullish Trends Emerge
Chainlink’s price is $13.95, witnessing an impressive surge of more than 1.2 percent in the past day. The current price is trading above the $15 support level, with analysts optimistic about future bullish trends in the LINK price. The trading volume over the last 24 hours has surged to over $771 million, with an increase of 36%, pointing to a spike in investor activity. With a market capitalization exceeding $8.71 billion, Chainlink remains a formidable player among the top 20 cryptocurrencies by market value.
Crypto expert Ali points to a bullish trend highlighted with the help of a bull pennant pattern., a classic sign that often indicates an ongoing upward trajectory. This is further supported by a robust demand zone established in the range between $14.8 and $15.2. In this zone, 17,650 addresses have accumulated approximately 85.12 million $LINK tokens.
#Chainlink has built a solid demand zone between $14.8 and $15.2, where 17,650 addresses bought 85.12 million $LINK. With the lack of resistance ahead, #LINK could be positioned to advance toward $20. pic.twitter.com/jJwfVbM4eE
— Ali (@ali_charts) January 15, 2024
This uptake of LINK suggests strong investor confidence and a potential catalyst for further price increases. Adding to this optimistic scenario is the current lack of significant resistance in Chainlink’s path forward. This absence of obstacles suggests that Chainlink is well-positioned for a potential surge, with targets speculatively set around the $20 mark.
Chainlink Technical Indicators Align with Bullish Sentiments
LINK price is at a crucial juncture; surpassing $17 could propel it toward $20, possibly achieving new highs. Conversely, a decline could see it lose vital support at $13. If Chainlink dips below this, especially touching the 100-day SMA at $13.19, it will negate the bullish perspective, potentially leading to a more significant downturn. These scenarios underscore the volatile and unpredictable nature of the cryptocurrency market.
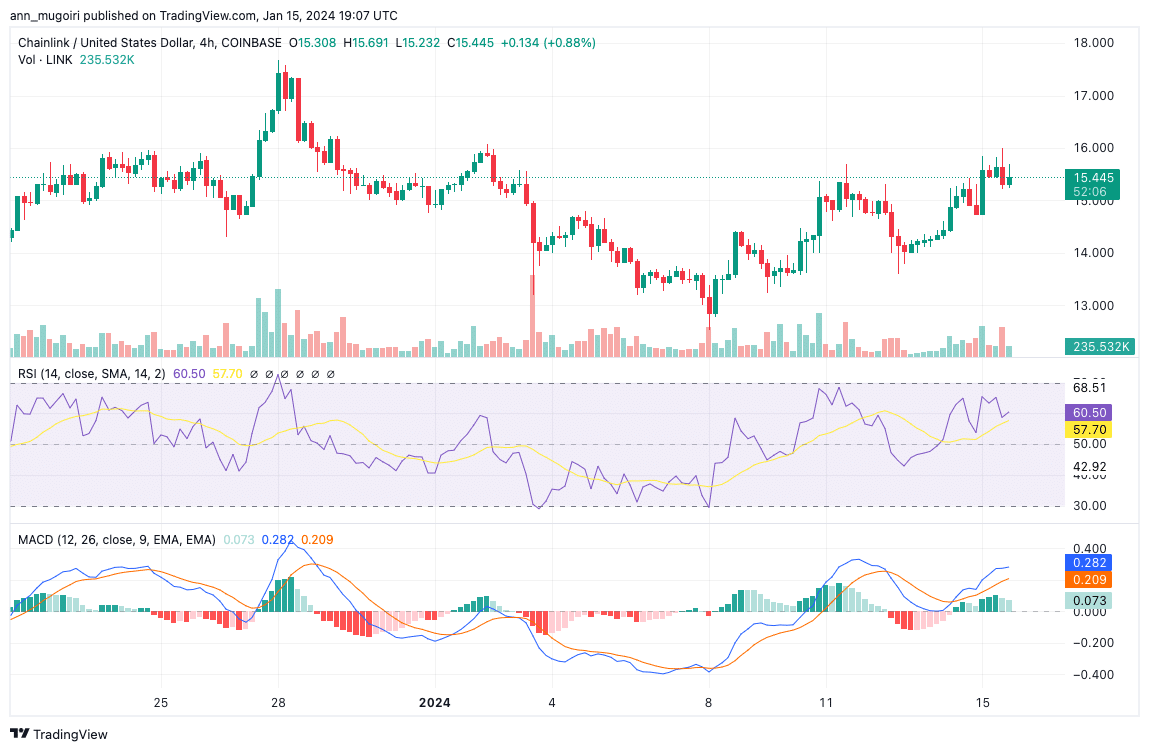
Chainlink price indicators are showing promising signs in the technical analysis realm. The Awesome Oscillator (AO) is exhibiting green bars on a four-hour chart, gradually advancing into positive territory.

LINK/USD 4-hour chart, Source: TradingView
Additionally, the Moving Average Convergence Divergence (MACD) indicator signals a potential bullish crossover as it moves closer to the upper side of its signal line, marked by an orange band. Further analysis reveals an upward trend in the Relative Strength Index (RSI), hinting at a possible crossing above its yellow signal line to validate a leg higher in Chainlink price.
Related Articles
- Chainlink Price Prediction: Can LINK Climb to New Highs as $34 Resistance Looms
- Binance Research Foresees Major Crypto Trends for 2024
- Binance Adds Manta Network As Manta Pacific’s TVL Surpass $800 Mln
Read the full article here

