Crypto Price Prediction: The market excitement towards spot Bitcoin ETFs, which started its trading days on Thursday, has started to decline. Despite witnessing a $4.6 billion trading volume on its listing days, the crypto market witnessed a sudden sell-off on Friday which recorded a 7.5% Drop in Bitcoin, 3.66% in Ethereum, and a 6-7% drop in XRP and Solana.
Anthony Scaramucci, the founder of SkyBridge Capital, recently shared his insights with Bloomberg on the factors influencing Bitcoin’s recent downturn. He highlighted that the decline in Bitcoin’s value could be partly attributed to the sale of Grayscale Bitcoin Trust shares. This activity intensified following the trust’s conversion to an ETF, a move approved by the U.S. Securities and Exchange Commission. According to Scaramucci, investors are offloading these shares to realize losses and are moving towards options with lower fees.
Additionally, Scaramucci highlighted another factor impacting Bitcoin’s price: the bankruptcy estate of FTX possibly selling off assets in response to the ETF announcement.
Despite these downward pressures, he remains optimistic about Bitcoin’s near-term prospects.
“There is a heavy volume of selling in Bitcoin right now. I do expect the supply overhang to be done in the next six to eight trading days.”
Thus, the BTC price may recuperate the bullish momentum in this correction and resume the recovery trend further.
Healthy Retracement Hints Bitcoin (BTC) Price Recovery is Intact
Bitcoin (BTC) Price| TradingView Chart
The recent launch of the first-ever spot Bitcoin ETF in the U.S. has been a notable event in the cryptocurrency market. However, Bitcoin (BTC) itself has faced challenges in surpassing the $48,000 resistance level.
Over the past 48 hours, there’s been a significant 12.5% drop in its value, bringing the price down to $42,943. This decline occurred after a reversal from the $48,000 barrier.
Presently, Bitcoin price is striving to maintain its value above a critical support level, which includes the 23.6% Fibonacci retracement level and a newly forming ascending trendline.
Such retracements are often seen as beneficial for the long-term trend, providing an opportunity for buyers to consolidate their positions. The resilience of this support level is evident as the price has repeatedly bounced back from it, suggesting an ongoing accumulation by buyers during these market dips, an indicator of a potential recovery.
In a recent post from on-chain data provider Glassnode. Bitcoin’s Hash Rate has hit a new record high, surpassing 600 EH/s! This incredible milestone means the network is now making over 600 quintillion calculations per second to solve the complex puzzles in block mining.
Increasing difficulty in mining and an upcoming halving event, could lead to a decreasing supply of new Bitcoin and potentially putting upward pressure on the price. Thus a bullish bounce from the aforementioned support could bolster buyers to rechallenge the $48000 barrier and chase potential targets of $53000, followed by $60000.
Will ENS Price Recovery Surpass $30 in January?

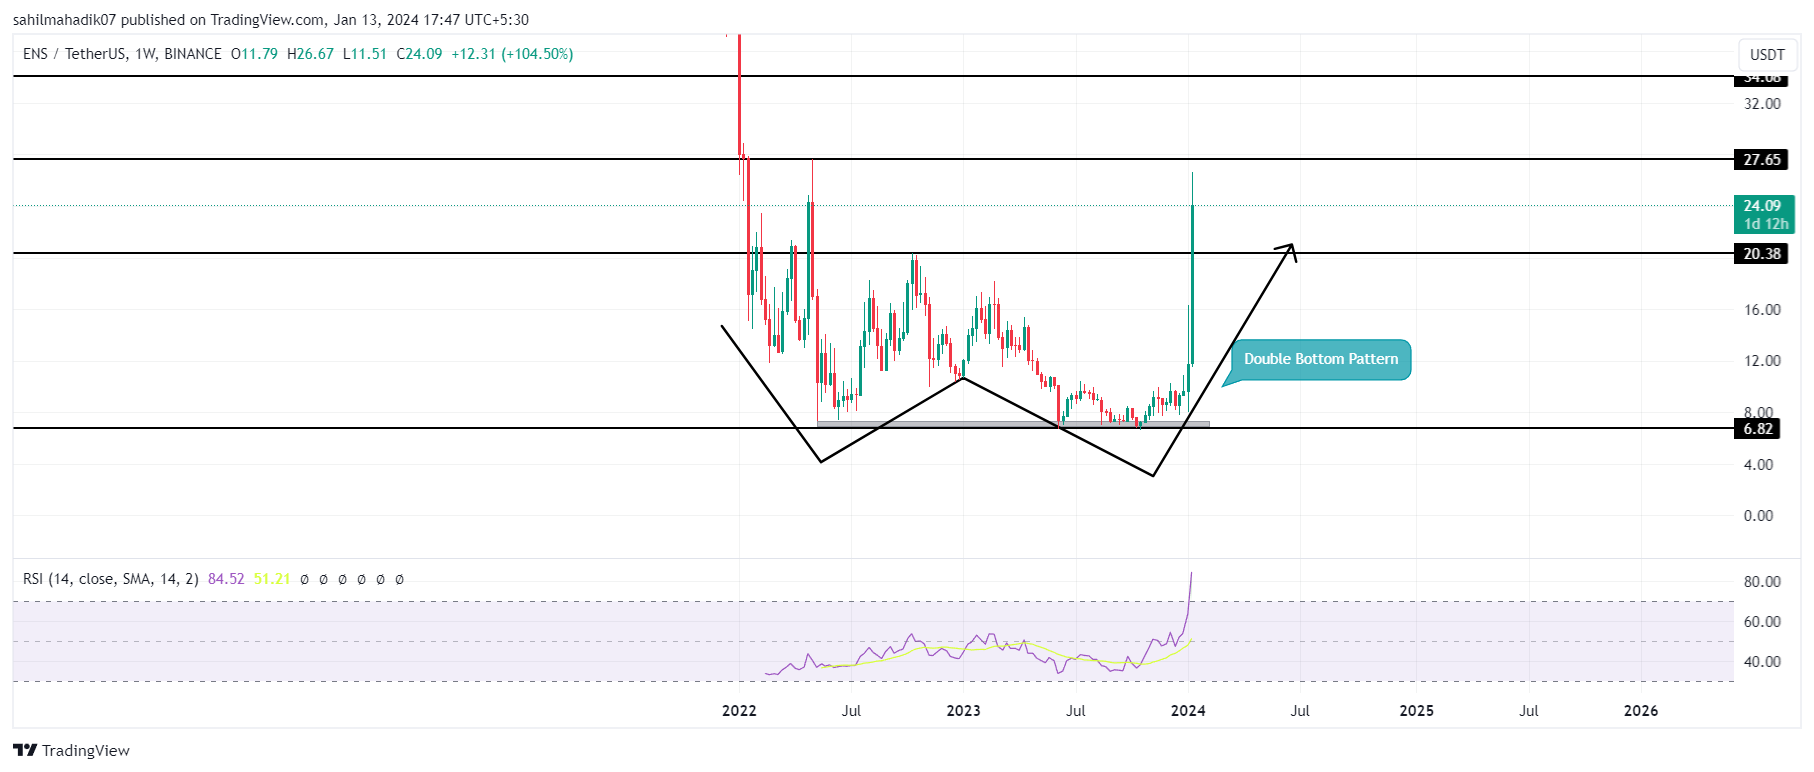
ENS Price| TradingView Chart
The Ethereum Name Service’s governance token, ENS, has witnessed a substantial recovery since January 3rd. This surge in demand followed a tweet by Ethereum co-founder Vitalik Buterin, who emphasized the importance of the ENS service.
He wrote “All L2s should be working on (trustless, merkle-proof-based) CCIP resolvers, so that we can have ENS subdomains registerable, updateable, and readable directly on L2s. ENS is super-important, it needs to be affordable.
Following this tweet, the ENS price found sustainability above the $8 mark and showed an aggressive surge. within two weeks, the coin price has surged 200% to currently trade at $24.03.
Amid this rally, the coin price has breached the $20.38 neckline resistance of the double bottom pattern. This chart projecting an early sign of trend reversal should increase accumulation in this asset. If the coin price shows sustainability above the neckline, the post-breakout rally could lead the ENS to value 42% to hit $34.
The daily RSI slope above 80% reflects an aggressive recovery trend in this altcoin
Key Resistance Breakout Sets Celestia (TIA) Price Rally to $25

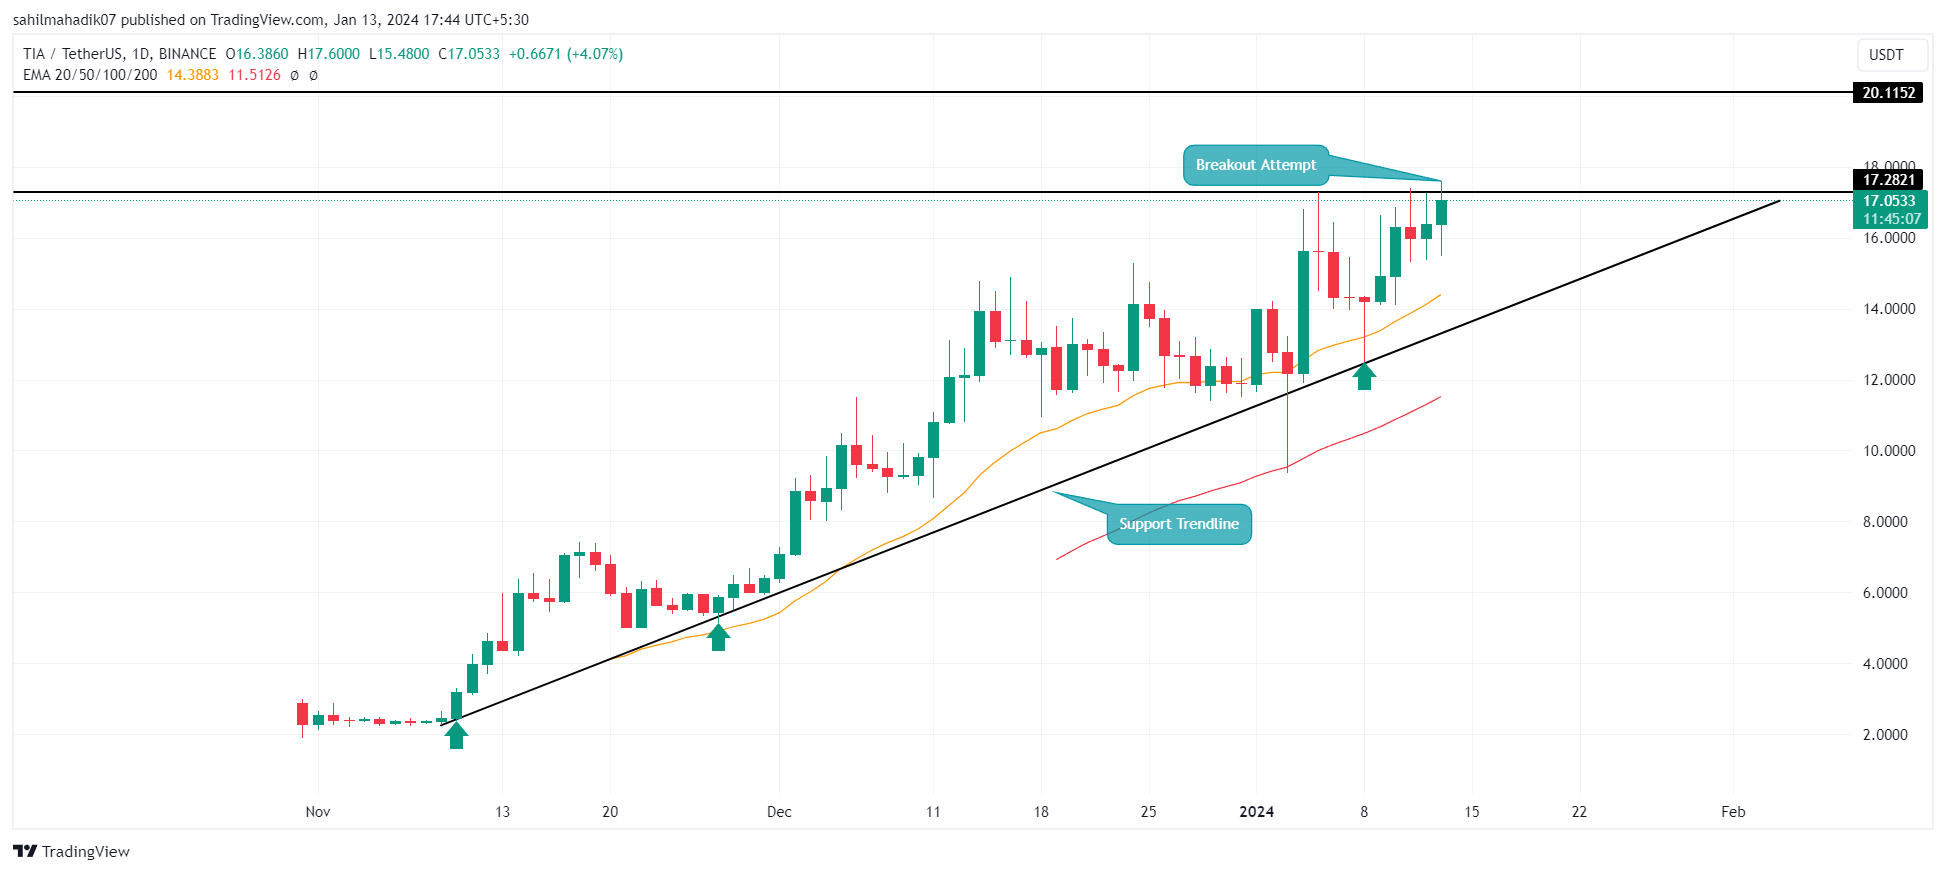
Celestia (TIA) Price| TradingView Chart
The Celestia coin has shown remarkable recovery over the last two months, supported by an ascending trendline. The coin’s price soared 663% from a low of $2.25 to the current $17.75.
This trajectory has consistently found support at the ascending trendline, a sign of active buyer accumulation during corrections, which is crucial for a sustained uptrend. With an intraday gain of 4.64%, the TIA coin price teases a breakout above $3.17 resistance.
A successful breach of this threshold could lead to a 16% increase in value, targeting the $20 mark and possibly extending to $25.
The 20- and 50-day EMA acts as an additional support level during the market correction.
Read the full article here

