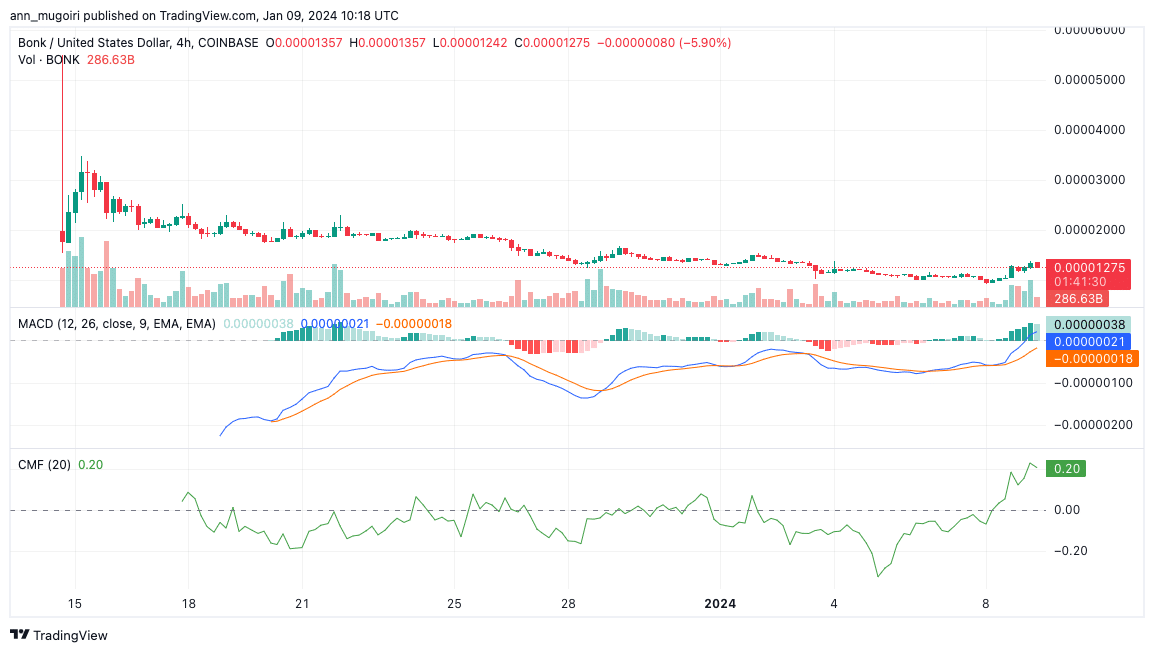
Bonk price dynamics have been a subject of intense interest in the cryptocurrency community. This Solana-based meme coin, BONK, has recently become a prominent gainer among major cryptocurrencies. Its social engagement has nearly doubled, fueling its market momentum. Presently, BONK’s value hovers around $0.00001363, marking a notable 26% increase in just a day.
The resurgence in Bonk’s value coincides with a broader market uplift. Positive developments in the crypto world have buoyed investor sentiment. Bonk’s market capitalization has soared past $800 million, placing it as the 81st largest digital asset. Notably, trading volumes for BONK escalated by over 129% to $282.75 million, as per the latest figures from CoinMarketCap.
Source: Tradingview
In recent trading history, BONK price fluctuated between $0.000009326 and $0.00001309 for an extended period. This was followed by a dramatic surge of 141%, only to meet resistance at $0.00003162. The coin’s momentum faltered, leading to a period of sideways trading as 2023 ended. The onset of 2024 saw a bearish trend, with a 5% correction in BONK’s price. Currently, it oscillates within a narrow range, suggesting a tentative market stance.
OKX Listing: A Potential Catalyst
A major development for BONK is its forthcoming listing on OKX, a leading global cryptocurrency exchange. This move is expected to broaden BONK’s exposure and investor interest, particularly within the Solana ecosystem. The inclusion of BONK on OKX’s platform could be a significant driver for its market performance.
OKX announced the listing of Jito (JTO) and Bonk (BONK) . JTO/USDT and BONK/USDT spot trading will open at 6:00 am UTC on January 8, 2024. Jito Network is a liquid staking protocol on Solana. BONK is a meme coin in Solana. https://t.co/vB2q2lcTyH
— Wu Blockchain (@WuBlockchain) January 8, 2024
As BONK attempts to break out of its current range, the market watches closely. If BONK maintains support above $0.0000136, further growth is anticipated, possibly reaching resistance levels of $0.00001732 and eventually $0.0000240. Conversely, a bearish takeover could see BONK testing lower support levels, potentially down to $0.000009362.
Technical Indicators and Market Sentiment
The Moving Average Convergence Divergence (MACD) indicates a growing buying interest, as evidenced by a rising histogram. A convergence of averages further supports this bullish trend, with the signal line rallying above the MACD line on a 4-hour chart. Additionally, the 50-day and 200-day moving averages are positioned above the current price, reinforcing a positive outlook. The Relative Strength Index (RSI) stands above 50, aligning with this optimistic perspective.

BONK/USD 4-hour price chart, Source: Tradingview
The current market trends for BONK are showing strong bullish signals, as the current price is above both the 10-day Simple Moving Average (SMA) and the 200-day SMA. This positioning indicates robust buying pressure within the market. Furthermore, positioning the 20-day Exponential Moving Average (EMA) above the 50-day EMA reinforces this bullish sentiment, suggesting a continuation of the upward trend. Additionally, the positive reading of $0.20 on the Chaikin Money Flow index confirms this trend, indicating a healthy influx of buying interest in BONK.
Related Articles
- OKX Lists Solana’s Bonk & Jito Spot Trading Pairs, Price Rebound Ahead?
- BONK Price Prediction for 2024: Poised to Surge to $0.00001857
- BONK Price Shoots 20%, Traders Are Preparing For Another Mega-Rally
Read the full article here

