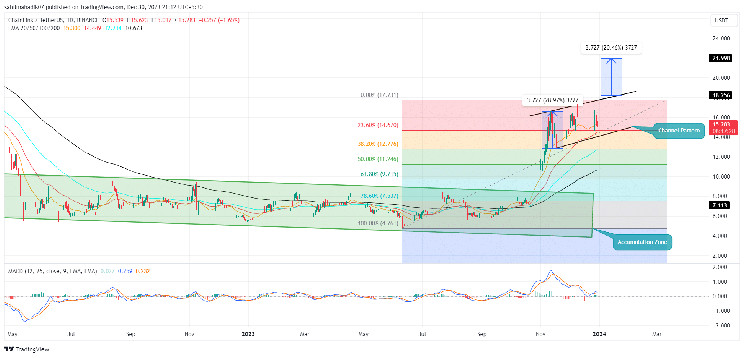
Chainlink Price Prediction: Amid the rising selling pressure in the crypto market, the Chainlink price has recently reverted from the resistance trendline of a channel pattern, falling 13.5% in the last three days to trade at $15.3. While the short-term trend in the market remains uncertain, this channel pattern has assisted LINK price to sustain higher levels with dynamic resistance and support trendline. Here’s how this pattern may influence the new future trend of this asset.
Also Read: Top Crypto Analyst Compares Investment Potentials Of Bitcoin (BTC) & Ethereum (ETH)
Will Chainlink Price Regain $20 Mark?
- A channel pattern in the daily chart prevents the LINK price from a major correction.
- A break above the overhead trendline will intensify the buying momentum
- The intraday trading volume in the LINK coin is $449 Million, indicating a 33% loss.
Chainlink Price Prediction| TradingView Chart
Amid the general bullish sentiment in the crypto market, the Chainlink coin price projected its sustainability above the $7 mark and initiated an aggressive recovery in late October. This rally assisted the buyers to escape a 20-month accumulation phase marked by a green rectangle and surged nearly 148% to mark a new yearly high at $17.67.
With the current market uncertainty, the LINK recovery momentum has weakened and pushed the trend projection sideways to trade within a channel pattern.
Recent insights from Lookonchain have revealed notable acquisition trends among major holders within the Chainlink [LINK] network. transferring a total of 417,834 LINK out of Binance over the past 48 hours. This move by a large holder suggests a strong confidence in the potential for this asset to continue its upward trend.
Thus, a possible upside breakout from the overhead resistance would offer buyers a suitable springboard to resume the recovery trend. The post-breakout rally could surge the Chainlink price another 20% to reach a potential target of $22
Is LINK Price at Risk of Another Correction?
While the current market outlook for Chainlink price seems strongly bullish, a breakdown below the channel’s lower trendline could bring a notable change in the market dynamics. This possible breakdown could intensify the selling pressure and trigger a correction phase of 12.8 followed by $11.3 which coincides with 38.2% and 50% Fibonacci retracement levels respectively.
- Experimental Moving Average: In case of prolonged correction, the rising 100-and-200-EMA can offer suitable support for buyers to recuperate bullish momentum.
- Moving Average Convergence Divergence. A recent bounce back of MACD(blue) and signal(orange) line from the midline support accentuates the recovery trend is intact.
Read the full article here

