JAPANESE YEN FORECAST
- The Japanese yen depreciates sharply against the U.S. dollar and the euro after the Bank of Japan maintains its policy of negative rates and only modestly tweaks its yield curve control program
- Japan’s Ministry of Finance says it has not intervened in the FX market recently
- This piece examines the crucial technical levels for USD/JPY and EUR/JPY to monitor in the upcoming trading sessions
Most Read: British Pound – GBP/USD and EUR/GBP Technical Outlooks
The Japanese yen suffered large losses against the U.S. dollar and euro on Tuesday following Bank of Japan’s monetary policy announcement. In early afternoon trading in New York, USD/JPY was up about 1.5% to 151.35, a level it had not reached since October last year. Meanwhile, EUR/JPY was up around 1.2%, breaking above the 160.00 threshold and hitting its highest mark in 15 years.
The BoJ maintained its benchmark rate unchanged at -0.10% and tweaked its yield curve control program, indicating that it would take a more flexible approach to controlling long-term rates. Under the new scheme, the institution would allow the 10-year government bond yield to rise above 1.0%, characterizing this level as a reference point rather than a rigid cap as previously considered.
If you are puzzled by trading losses, download our guide to the “Traits of Successful Traders” and learn how to overcome the common pitfalls that can lead to missteps.
Recommended by Diego Colman
Traits of Successful Traders
While the BoJ’s action is a step in the direction of dismantling its controversial accommodative position of the past decade, the measure didn’t live up to expectations after a media leak on Monday suggested that the institution, under Kazuo Ueda’s leadership, was prepared to implement a more substantial and meaningful change to its current strategy.
The yen’s drop was worsened by news that the Ministry of Finance had stayed out of FX markets recently. Traders believed that the government had taken measures to support the currency earlier this month, but official data contradicts this claim. This means that the high volatility experienced a few weeks ago, when USD/JPY broke above 150.00, was probably the result of trading algorithms.
With the BoJ not yet ready to exit its ultra-dovish stance altogether and the Japanese government not doing much to contain FX weakness, rampant speculative activity could keep driving USD/JPY and EUR/JPY higher in the near term. This could mean fresh multi-year highs for both pairs heading into November.
For a comprehensive view of the Japanese yen’s fundamental and technical outlook, make sure to download our free Q4 trading forecast today.
Recommended by Diego Colman
How to Trade USD/JPY
USD/JPY TECHNICAL ANALYSIS
USD/JPY broke out on the topside, clearing the 151.00 handle on Tuesday hitting its highest level in more than 12 months. With bullish momentum on its side, the pair could soon challenge a key ceiling at 151.95, which corresponds to last year’s peak. On further strength, the focus shifts to channel resistance at 152.85.
On the flip side, if the bears return and trigger a pullback, initial technical support becomes visible at 150.95. Breaching this floor could entice new sellers to enter the market, setting the stage for a retracement towards 148.90. Below this area, traders’ attention turns to the psychological 148.00 handle, followed by 146.00.
USD/JPY TECHNICAL CHART
USD/JPY Chart Created Using TradingView
Explore the impact of crowd mentality on FX trading dynamics. Download our sentiment guide to understand how market positioning can offer clues about EUR/JPY’s trajectory.
| Change in | Longs | Shorts | OI |
| Daily | 20% | 4% | 7% |
| Weekly | 35% | 1% | 8% |
EUR/JPY TECHNICAL ANALYSIS
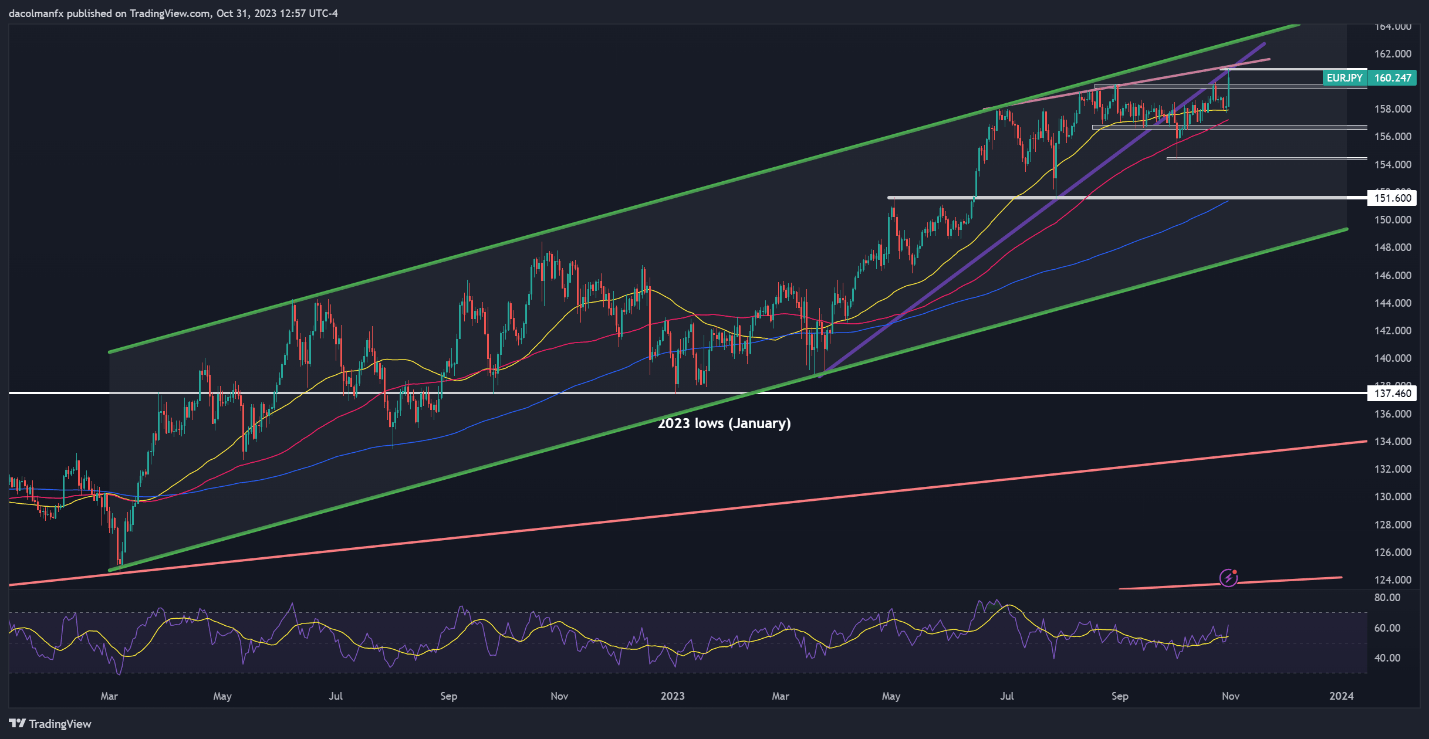
EUR/JPY also blasted higher on Tuesday, capturing its strongest level in 15 years. Despite this outsize rally, the pair failed to clear trendline resistance at 161.00. For clues on the outlook, this technical zone should be watched carefully in the coming days, bearing in mind that a breakout could spark a move towards 162.80.
In the unexpected event that sellers regain control of the market, support can be spotted at 159.70. Below this area, the focus shifts to 156.65 and 154.50 thereafter.
EUR/JPY TECHNICAL CHART

EUR/JPY Chart Created Using TradingView
Read the full article here

