Bitcoin Price Prediction: In November, the Bitcoin price largely fluctuated around the $38,000 threshold, indicating a period of consolidation in the market. This stagnation was marked by strong overhead resistance, casting a shadow of uncertainty over the cryptocurrency’s trajectory. However, a recent surge beyond this resistance level signals a revived bullish trend and hints at a possible continuation of an upward trajectory.
Also Read: Here’s Why Robert Kiyosaki Advises Buying Bitcoin Amid A Potential Market Collapse
Will Bitcoin Price Recovery Extend to $40000?
- An expanding channel pattern is leading the current recovery trend in Bitcoin price.
- The rising prices may face supply pressure around the $40,000 psychological barrier
- The intraday trading volume in Bitcoin is $11.3 Billion, indicating a 50% loss.
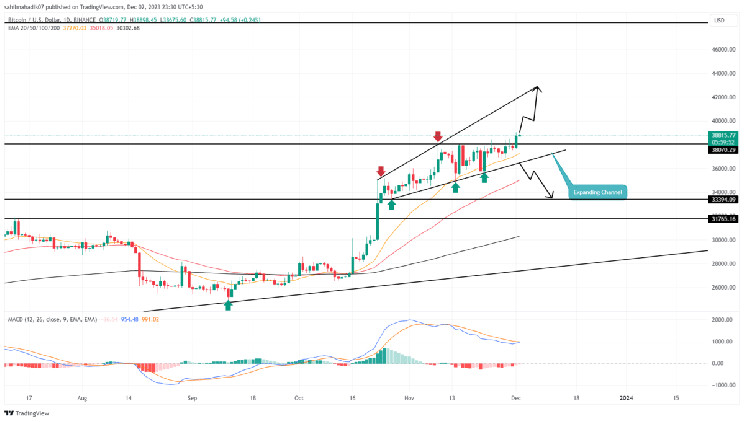
Bitcoin Price Prediction | TradingView Chart
Over the last six weeks, the Bitcoin price has demonstrated a gradual yet consistent recovery, guided by an expanding channel pattern. This pattern has been pivotal in shaping market dynamics, with the coin price bouncing repeatedly between its upper and lower boundaries.
Notably, on November 22nd, the BTC price underwent a significant reversal from the pattern’s lower trendline, resulting in an 8.7% increase in value over the subsequent two weeks, pushing its price to $38,800.
This upward movement was further bolstered by the breach of a crucial weekly resistance at $38,000. Should this resistance transform into a support level, it could further fuel Bitcoin’s ascent, potentially reaching or even surpassing the $42,000 mark, provided the channel pattern holds.
Conversely, a breakdown below the pattern’s lower trendline could trigger a major correction.
BTC vs ETH Performance

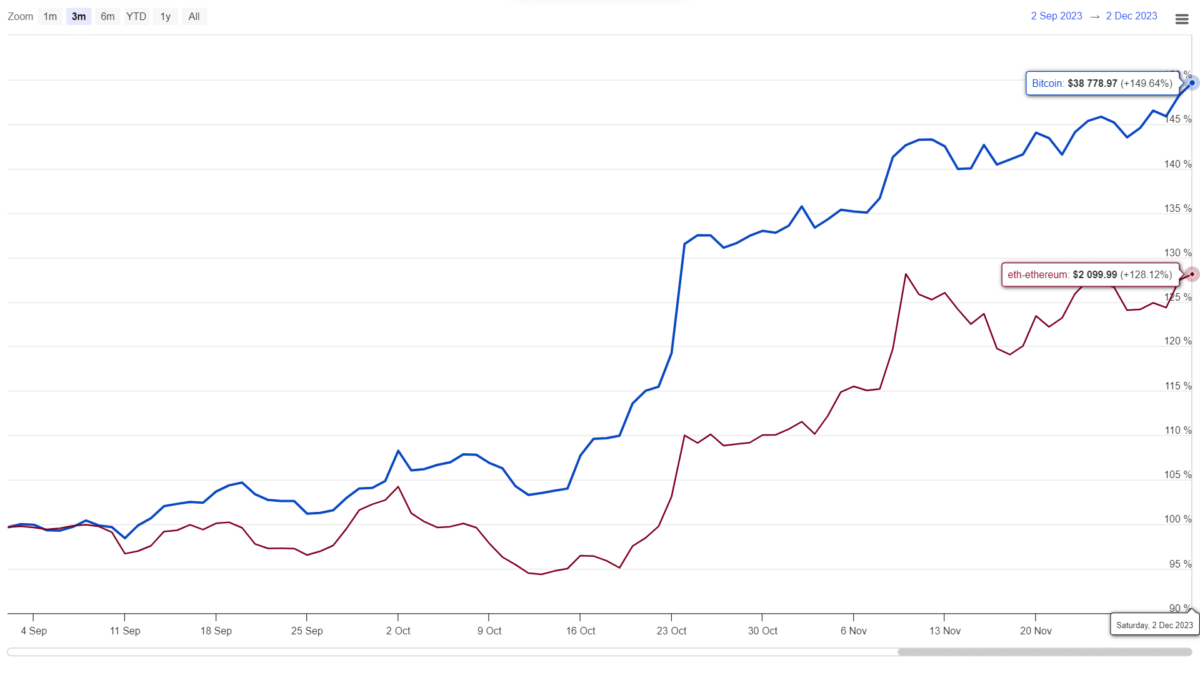
Coingape| Bitcoin Vs Ethereum Price
In a broader context, the past three months have been favorable for the crypto market, with Bitcoin and Ethereum, the two leading cryptocurrencies, experiencing notable growth, especially in October and November. While Ethereum price shows signs of diminishing bullish momentum, as indicated by a lower high pattern, BTC price displays a more stable growth trajectory, achieving new highs.
- Moving Average Convergence Divergence: A bullish crossover between the MACD(blue) and signal(Orange) line should encourage the BTC price to return to a recovery trend.
- Exponential moving average: The 20-day EMA slope continues to act as a dynamic support amid the occasional pullback.
Read the full article here

