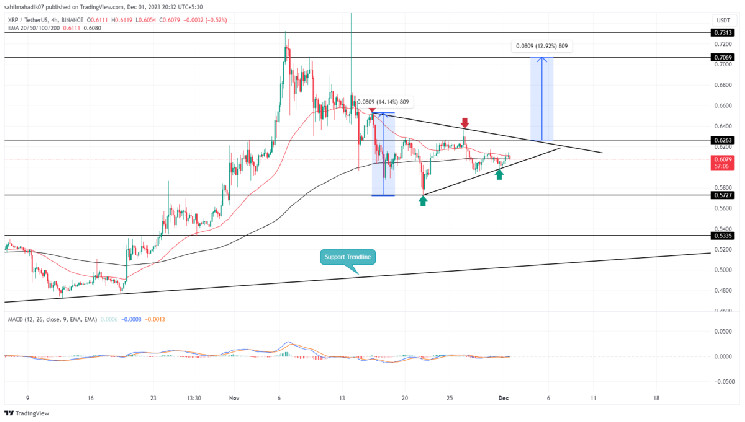
XRP Price Prediction: The ongoing struggle of Bitcoin price to breach the $38,000 resistance has cast a shadow of uncertainty over the market. This ripple effect is noticeable in the XRP price, which has recently entered a phase of lateral fluctuation. This trend follows the buyer’s stabilization at a support level of $0.57. Currently, the XRP price trajectory is being shaped by a symmetrical triangle pattern, a development that offers insights into its short-term forecast.
Also Read: SEC Meeting Raises Hopes for Ripple-XRP Case Resolution
Triangle Pattern Sets a Rebound To $0.7
- Under the influence of a symmetrical triangle pattern, the XRP price could remain sideways for the coming week.
- The XRP Price trading above the 50% Fibonacci Retracement Level reflects the overall recovery trend is intact.
- The intraday trading volume in the XRP is $865 Million, indicating a 15% loss.
XRP Price Prediction | TradingView Chart
Over the last fortnight, the XRP price has been trading within a confined range, delineated by the converging lines of this symmetrical triangle. Notably, the cryptocurrency has bounced back from these trendlines twice, underscoring the significant influence this pattern holds over market behavior.
With a modest intraday increase of 0.6%, the XRP price has recently rebounded from the lower boundary of this pattern, now hovering around the $0.606 mark. This bullish reversal is likely to lead to a 3% uptick only to encounter immediate resistance at the triangle’s upper boundary.
While the overhead resistance may prolong the sideways trend, the converging nature of the pattern would eventually result in a breakout move. If recent corrections have sufficiently rekindled bullish momentum, an upward breach of the triangle’s upper trendline would mark the continuation of a recovery trend.
This scenario could propel the XRP value by 12%, reaching the key $0.7 threshold.
Support Trendline Keep the Long-Term Trend Bullish
While the prevailing trend leans bullish, a downward break through the triangle’s support line could amplify selling pressure, potentially triggering an extended correction phase. In this case, the XRP price could descend to $0.57, and possibly further to $0.53. However, a broader perspective reveals a long-term ascending trendline that has consistently provided dynamic support to XRP, presenting buyers with a favorable dip opportunity.
- Exponential Moving Average: The XRP price wavering around the 200-day EMA slope reflects indecisive sentiment among traders.
- Moving Average Convergence Divergence: A bullish crossover between the MACD and signal line accentuates the rising buying pressure amid the current correction trend.
Read the full article here

