
Dogecoin (DOGE) is back on the move after a brief correction from November highs at $0.0877 to support slightly above $0.7. Unlike other cryptos, the most prominent meme coin is not trimming gains but rebounding towards the psychological resistance at $0.1.
In the last seven days, DOGE price has increased by 8.5% to $0.082 not to mention the cumulative 17% gains in 30 days, CoinGecko market data shows. Over half a billion dollars in trading volume has been recorded by traders across exchanges with the market cap growing to $11.6 billion.
Dogecoin Price Prediction: DOGE Recoils From Double-Bottom Pattern
The path with the least resistance has sustained upwards since Dogecoin price hit the bottom twice at $0.058. Recovery above all three moving averages including the 50-day Exponential Moving Average (EMA) (red), the 100-day EMA (blue), and the 200-day EMA (purple) assured traders of a bullish era.
Further movement above the double-bottom pattern’s neckline resistance called upon more traders to launch long positions in DOGE. This contributed immensely to the tailwind, which pushed Dogecoin price to $0.0877.
With the neckline resistance successfully tested, resulting in an ongoing uptrend continuation, DOGE might close the gap to $0.1 before or during the weekend.
Dogecoin price prediction chart | Tradingview
The Relative Strength Index (RSI) at 61 reveals buyers have the upper hand. As this trend strength indicator climbs toward the overbought region above 70, the odds flip in favor of the bulls.
A bullish cross pattern is on the cusp of forming if the 100-day EMA moves above the 200-day EMA. This would be the third golden cross in November. The initial bullish cross came into the picture when the 50-day EMA flipped above the 100-day EMA, followed by the second one when the same 50-day EMA moved above the 200-day EMA.
According to an anonymous analyst, seba26-77, who posts insights on Tradingview, Dogecoin price is dealing with the same resistance it was struggling to break roughly a year ago.
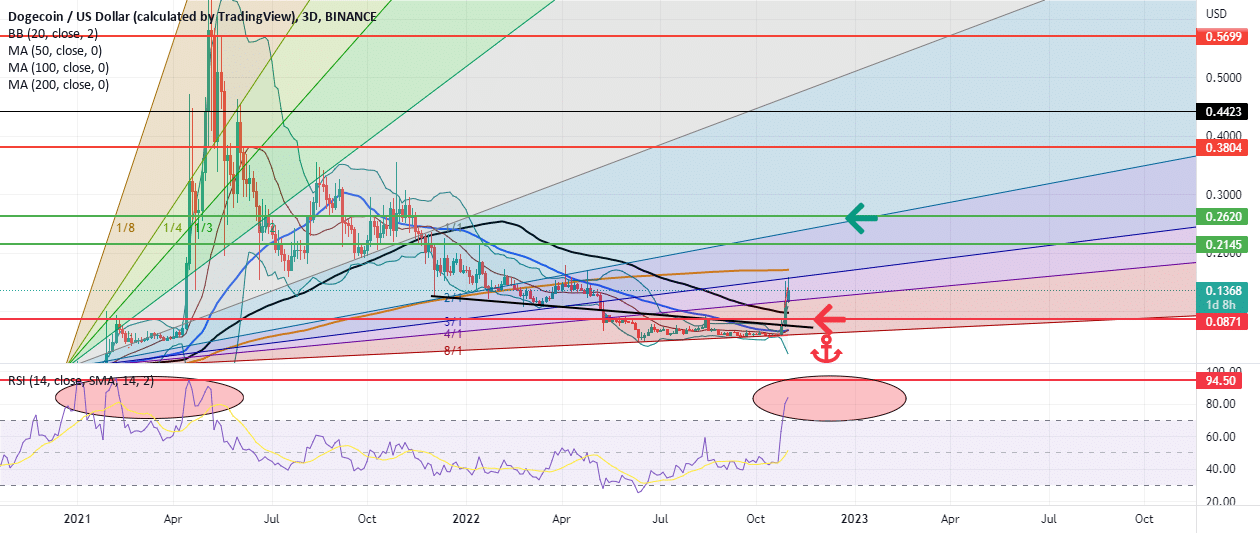
Dogecoin price prediction chart | Tradingview
From the chart, DOGE must break the blockade at $0.086 in the coming days – a move likely to see it rise to $0.12 by the end of 2023, representing a 60% move from the current market value.
The weekly chart reveals a breakout from a falling wedge pattern. This pattern serves as a continuation signal, allowing for consolidation due to profit-taking, ahead of another breakout.
Dogecoin price is expected to keep the uptrend intact as long as the breakout is backed by increasing volume. Moreover, the 50-week EMA is in line to provide support at $0.755.
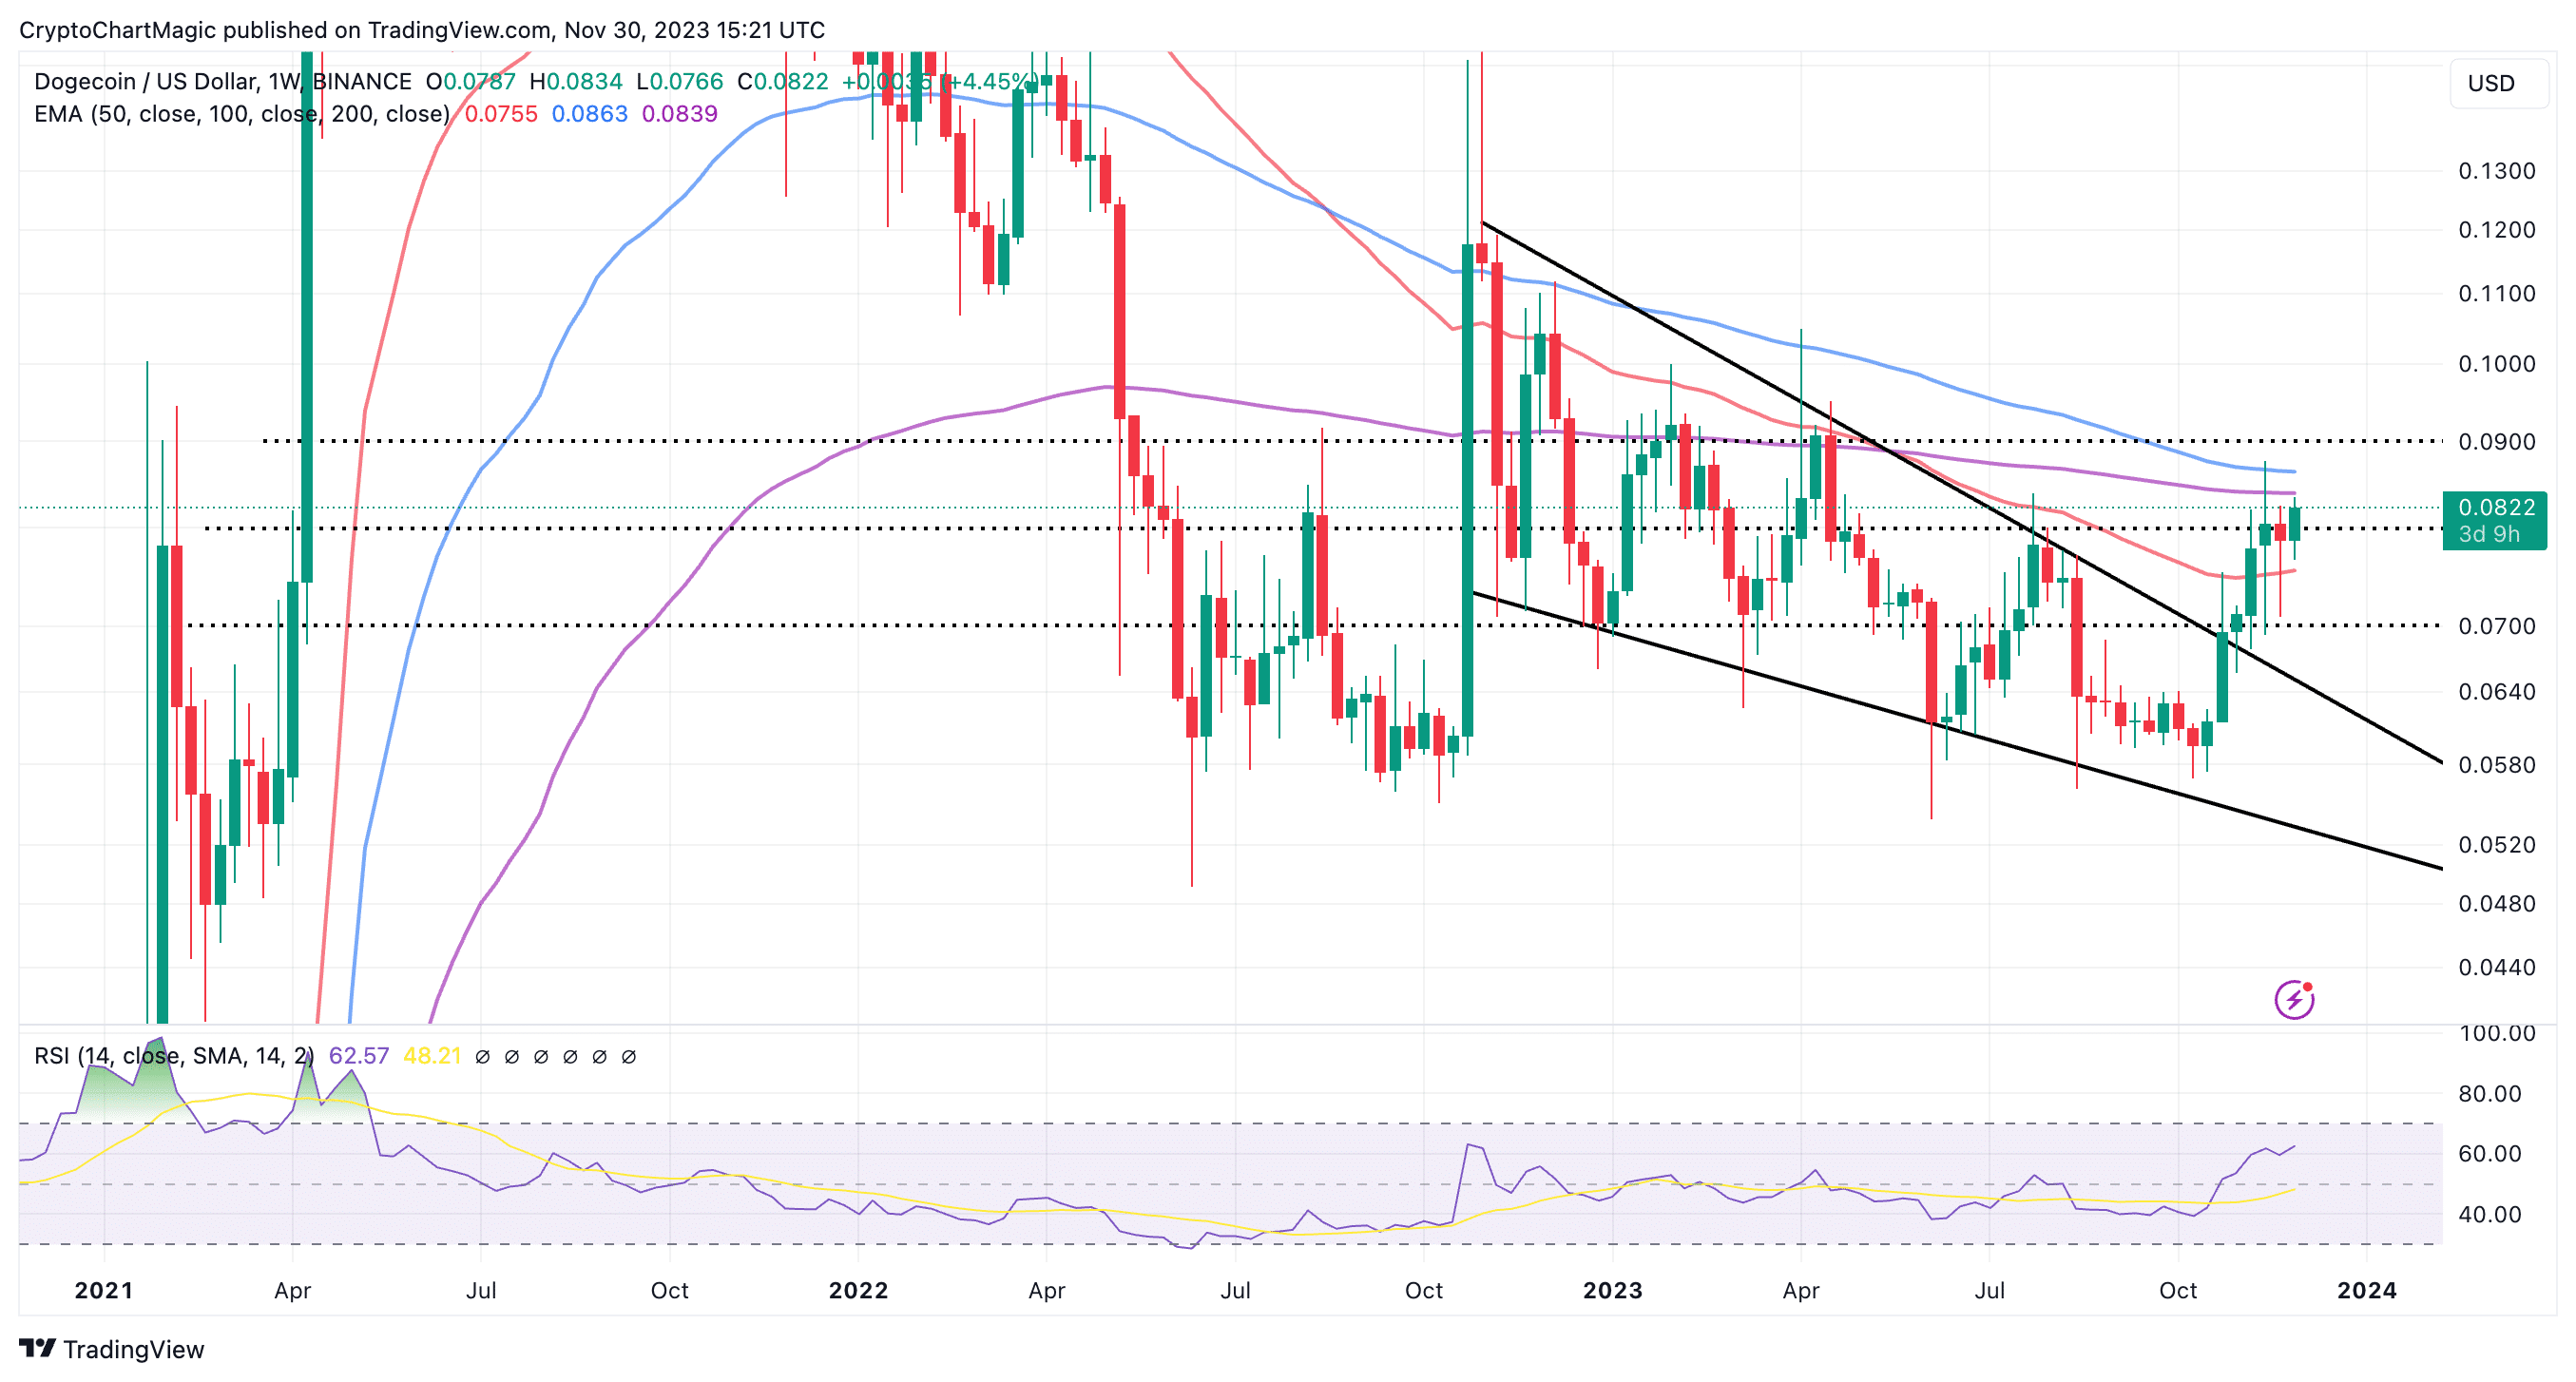
Dogecoin price prediction chart | Tradingview
It would not be prudent to assume that Dogecoin is out of the woods, with the 200-week EMA hindering movement at $0.0839 and the 100-week EMA at $0.864. Trading above these two key zones might encourage more buyers to join the uptrend due to the possibility of DOGE price starting a new bullish phase above $0.1.
Related Articles
- LUNC Perpetual Contract Launch: Is Terra Classic (LUNC) Set For A Bullish Surge?
- Bitcoin Bull Cathie Wood’s Ark Invest Sells Coinbase (COIN), Buys Robinhood Shares
- Ethereum Price Prediction: Will $ETH Surpass $3000 in December?
Read the full article here