Terra Classic Price Prediction: In the last two weeks, the Terra Classic coin experienced a notable correction, plummeting from a high of $0.000079 to its current trading value of $0.0000723, marking a significant 25% decrease. This downward trend gained further traction on November 21, amidst the broader crypto market’s adverse reaction to news of Binance CEO Changpeng Zhao’s resignation following allegations of violating U.S. anti-money laundering laws. Despite this, the LUNC price trajectory within a falling wedge pattern suggests the potential for a bullish comeback.
Also Read: Terra Luna Classic Community Passes Proposal For v2.3.0 Upgrade, LUNC Jumps
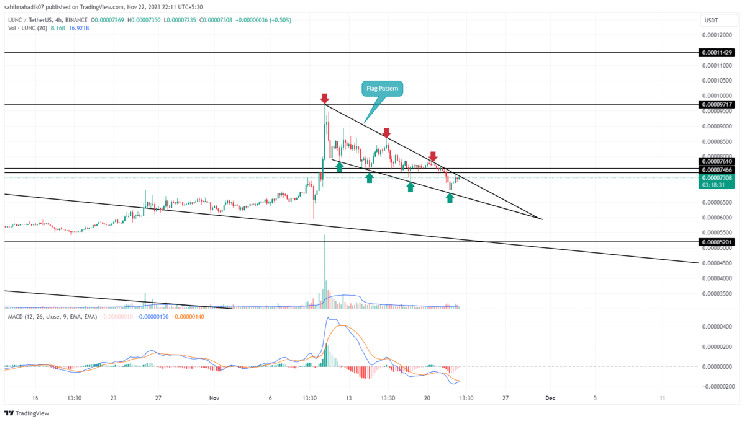
Terra Classic Price Prediction: Is $LUNC Heading to $0.00008
- Flag pattern formation may push recovery rally to $0.000079-$0.00008.
- The lower trendline of the flag prevents LUNC from a major downfall.
- The intraday trading volume in the LUNC coin is $35.5 Million, indicating a 47% gain.
Source- Tradingview
The current correction in LUNC price came after a substantial recovery from mid-October to early November, hinting at the formation of a bullish flag pattern. This pattern suggests that the recent decline could be a temporary setback before a more substantial recovery.
Over the past two weeks, the coin price repeatedly bounced back from the lower trendline of this pattern, underscoring its significant impact on market sentiment. As of now, Terra classic coin trades at $0.0000726 and appears to be reversing from the upper trendline again.
The narrowing wedge pattern points towards an imminent breakout, with a high likelihood of breaching the upper trendline, providing a robust support base for continued bullish momentum.
Should this breakout occur, we could anticipate a potential surge of up to 32%, potentially revisiting the previous high of $0.000079.
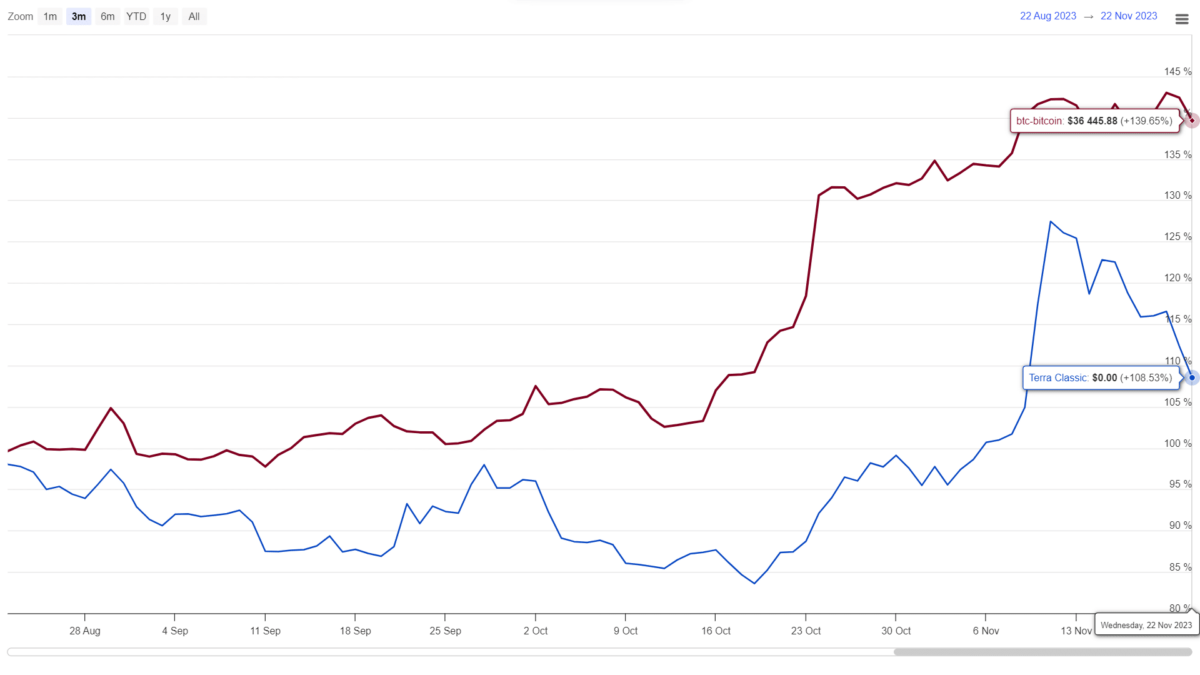
LUNC vs BTC Performance
 Source: Coingape| Terra Classic Vs Bitcoin Price
A three-month behavior of the LUNC Coin price alongside Bitcoin reveals that both benefited from the October-November rally. However, as market uncertainty prevails, the LUNC price has shown a significant downturn, indicating a weakening of bullish strength, especially in comparison to more stable Bitcoin price.
- Bollinger Bands: A downtick in the lower boundary of the Bollinger Band indicator reflects the selling momentum intact.
- Moving Average Convergence Divergence: The MACD and signal slope below the middle line indicate the sellers have an upper hand over the asset.
Read the full article here

