Cardano has been one of the coins to watch during the recent bull run and is currently showing promising signs of continuing higher.
By Edris Derakhshi (TradingRage)
The USDT Paired Chart
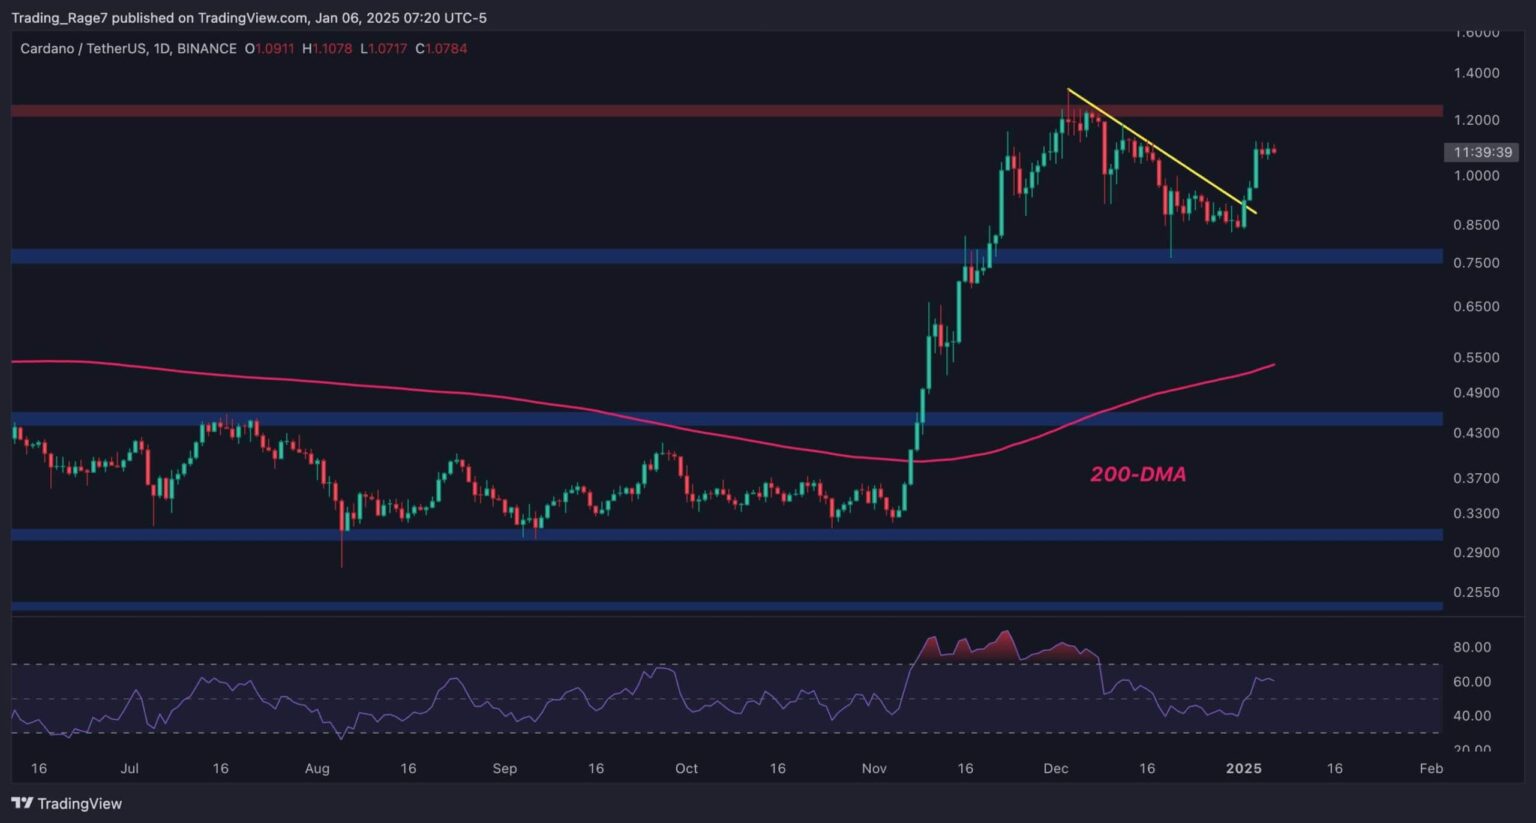
The ADA/USDT’s daily chart demonstrates interesting price action. The asset has been declining gradually since getting rejected by the $1.2 resistance level. However, the market has experienced a quick reversal at the $0.75 support level and broke the bearish trendline higher.
As a result, the asset is rallying toward the $1.2 resistance level at the moment, and a breakout could potentially lead to a rally toward a new record high.
The BTC Paired Chart
The ADA/BTC price action on the daily timeframe looks quite similar to the USDT paired chart. The market has been supported at the 900 SAT level and is now rising toward the 1,500 SAT resistance zone once again.
With the RSI indicating that the momentum is bullish, it is quite probable that the market will reach the mentioned zone, which would mean that ADA is likely to outperform BTC in the upcoming weeks.
Read the full article here

