
- 1 Balancer price prediction suggests a sharp upmove is possible after the BAL crypto breaks out of the 200-day EMA.
- 2 BAL price is trading in between the 50-day EMA and the 200-day EMA.
- 3 The buyers are active near the $3.00 demand zone.
Balancer price prediction suggests a sharp rise in the BAL crypto is possible in the coming months. BAL crypto price took support near $3.00 and took a U-turn from the lows. It climbed above the 50-day EMA and began to recover by forming high candles.
Meanwhile, the buying volume also surged and the price showed a steep recovery. All these are happening at the same time showing that the recent upmove is real and sustainable.
Recently, sellers tried to pull the price below the 50-day EMA. However, due to the strong presence of bulls, the price bounced back and displayed a bullish hammer candle.
Later, the price continued the momentum and hit a swing high at $4.200. However, the price witnessed a minor profit booking and retraced back to the 50-day EMA.
The chart structure of the BAL crypto is mildly bullish and buyers look more active as compared to sellers. Therefore, it is better to play along and stay with the trend.
At the time of writing, Balancer price is trading at $3.693 with an intraday decline of -0.32%. The 24-hour volume to market cap is 4.36%.
Balancer Price Analysis: Are Bulls Returning?
Source: BAL/USDT daily chart by Tradingview
Balancer price prediction says BAL crypto is preparing to hit a new swing high in the coming months. After a long time, the correction has taken a halt and bulls are returning to the track.
Till the BAL price sustains above $3.00 and any minor correction will be easily absorbed by the buyers. Moreover, if the price holds the 50-day EMA, then bulls will continue their dominance and increase the possibility of a breakout.
The next phase of the rally will be visible when buyers succeed in breaking out of the $4.200 hurdle. The analysis suggests that the BAL price is getting ready for the breakout which triggers further momentum.
BAL Price Volatile on Daily and Weekly Chart
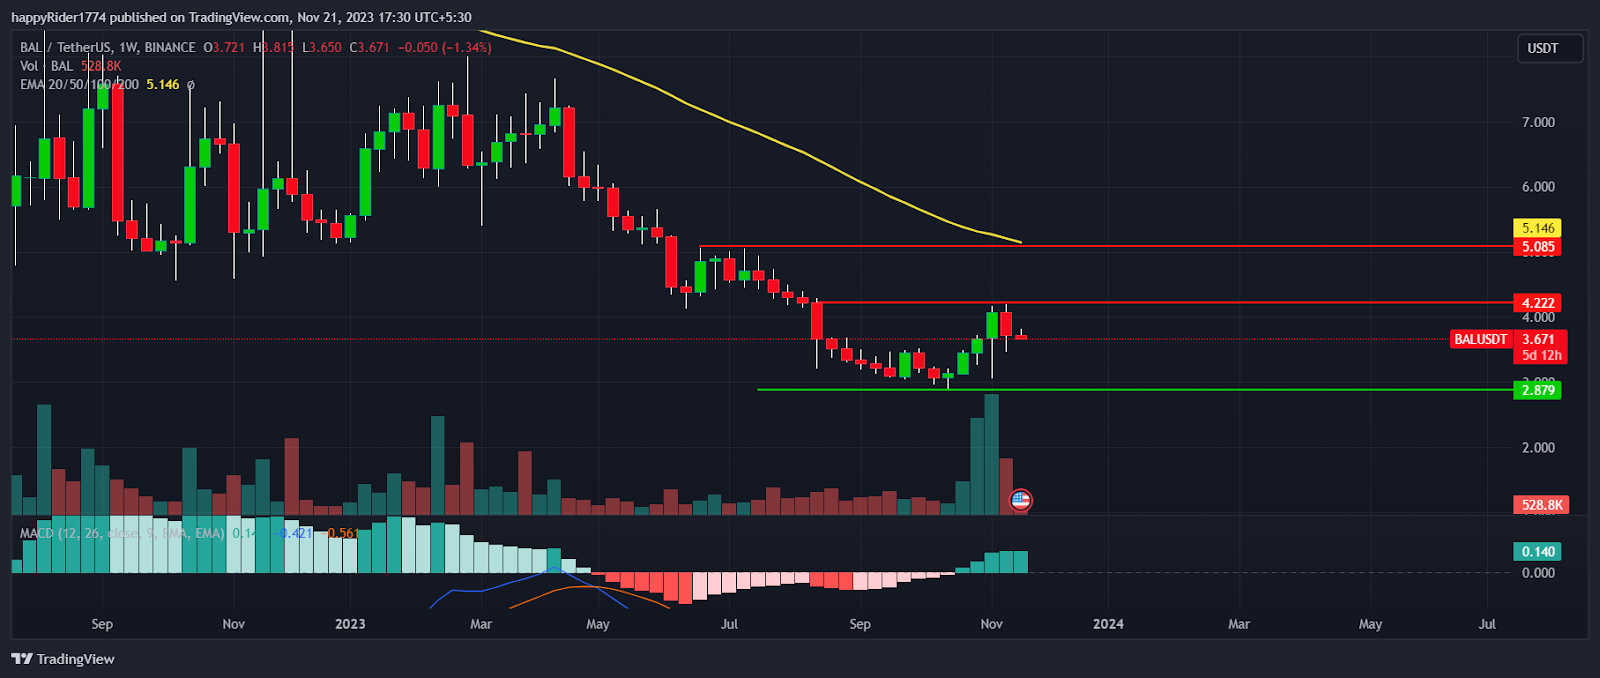
Source: BAL/USDT weekly chart by Tradingview
BAL price is quite volatile on a daily and weekly chart. It shows that speculators are active which increases the possibility of the fake breakout. Therefore, until the Balancer price breaks out of the $4.200 hurdle, investors and traders must be careful.
Track all markets on TradingView
On a daily chart, the MACD curve reverses down and the histogram forms red bars. It indicates mild bearishness. However, the price action stays bullish and favors the bulls. The supertrend and RSI both support the price action and suggest the next breakout is coming.
Conclusion
Balancer price prediction is bullish and suggests that the $5.00 mark is achievable. BAL crypto price is consolidating near the supply zone for the base formation.
The bulls are active near the $3.500 level, so they might break the 200-day EMA barrier in the coming few weeks.
Technical Levels
- Resistance Levels: $4.222 and $5.085
- Support Levels: $3.200 and $2.879
Disclaimer
The views and opinions stated by the author, or any people named in this article, are for informational purposes only. They do not establish financial, investment, or other advice. Investing in or trading crypto assets comes with a risk of financial loss.
Read the full article here