
Este artículo también está disponible en español.
Ethereum (ETH) has experienced a lackluster phase in recent weeks, with the asset seeing small price surges but still struggling to hold near or above the $3,000 mark after a brief rally in August.
According to a recent analysis from a CryptoQuant analyst, the behind the scenes of this price struggle for ETH has been quite interesting, with the asset seeing a significant shift in its netflow.
This shift in Ethereum’s netflow could have significant implications for ETH, potentially influencing the market’s reaction positively or negatively.
Related Reading
Dissecting The Ethereum Netflow
The CryptoQuant analyst Amr Taha revealed in a recent post on the CryptoQuant QuickTake platform that Ethereum has recently experienced a spike in netflows, with approximately 96,000 ETH moving into derivative exchanges.
According to Taha, this influx could indicate that traders are positioning for potential price shifts, as large transfers to derivatives platforms have historically preceded periods of increased volatility or even corrections.
Taha’s analysis, backed by previous spikes in May and early July, suggests that Ethereum’s current activity might foreshadow a heightened period of market movement. The analyst wrote:
The latest spike in netflow could signal another period of heightened market activity, potentially a price correction or a sharp move based on trader positioning.
Market Sentiment Drawn From Bitcoin
In addition to Ethereum’s netflows, Taha delved into Bitcoin’s Futures Sentiment Index, observing that this metric shows peaks in sentiment that may serve as indicators of broader market behavior.
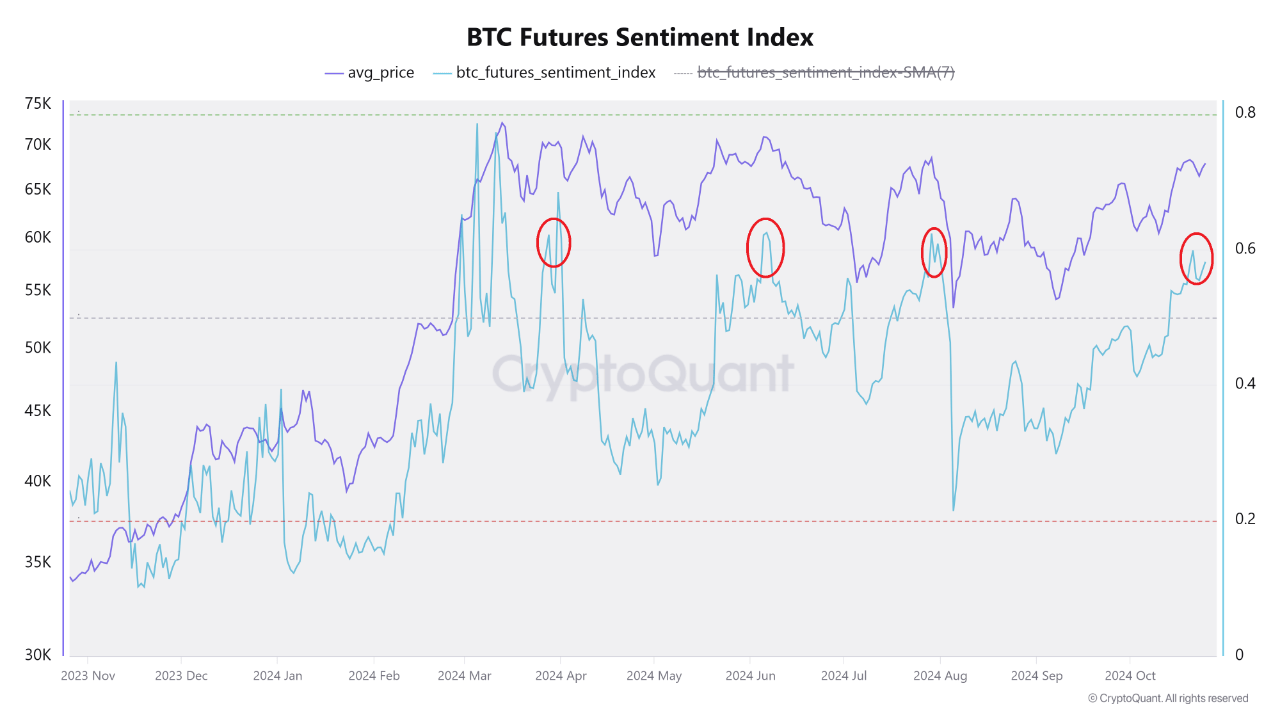
He pointed out three instances where the sentiment index spiked, marked by red-circled peaks (in the chart above), each time coinciding with a local market top. This trend implies that, following peaks in trader sentiment, Bitcoin’s price typically experiences a decline.
The sentiment index, thus, can serve as a “contrarian indicator”—when optimism peaks, price corrections often follow. These sentiment patterns may signal that investors should brace for potential volatility for Ethereum, which is highly correlated with Bitcoin.
Related Reading
Meanwhile, Ethereum has continued to hover somewhere below $3,000. So far, the asset has registered a correction in the past week, dropping by 3.1%. However, the past day performance is attempting to be more positive.
Over this period, Ethereum has seen a slight increase of 0.9%, rising to as high as $2,559 earlier today before now trading for $2,541, at the time of writing.

Despite the notable fluctuation the asset has seen in the past week alone, rising to above $2,700 and dropping below $2,500, Ethereum daily trading volume seems to have maintained composure.
Data from Coingecko shows that this metric has remained between $15 billion and $19 billion in the past week with no major spike or decline.
Featured image created with DALL-E, Chart from TradingView
Read the full article here