Technical analysis is an important indicator that traders, especially those operating in the futures market, need to constantly follow in the cryptocurrency market. So, what clues does technical analysis give us for Ethereum, which is currently trading at $1938? Let’s examine in detail the chart analysis, important support and resistance levels.
Daily Chart Analysis for Ethereum
The first notable formation on the daily chart for Ethereum is the ascending channel formation. According to this, maintaining this structure since July 2022 continues to ensure that investors trade confidently in Ethereum pairs. However, with the recent decline, danger bells may start ringing for the Ethereum price. Especially, staying below the EMA 7 (blue line) level is a negative situation in the short term.
The most important support levels to be considered for Ethereum on the daily chart are respectively; $1879, $1817, and $1759. Especially, if the daily bar closes below the $1759 level, which is below the EMA 200 (red line) level, it may cause a significant loss of momentum in the Ethereum price.
The most important resistance levels to be followed for Ethereum on the daily chart are respectively; $1958, $2035, and $2132. Especially, if the daily bar closes above the $2132 level, which is the most significant obstacle encountered in the recent rise, it will help the Ethereum price gain significant momentum.
Two-Hour Chart Analysis for Ethereum
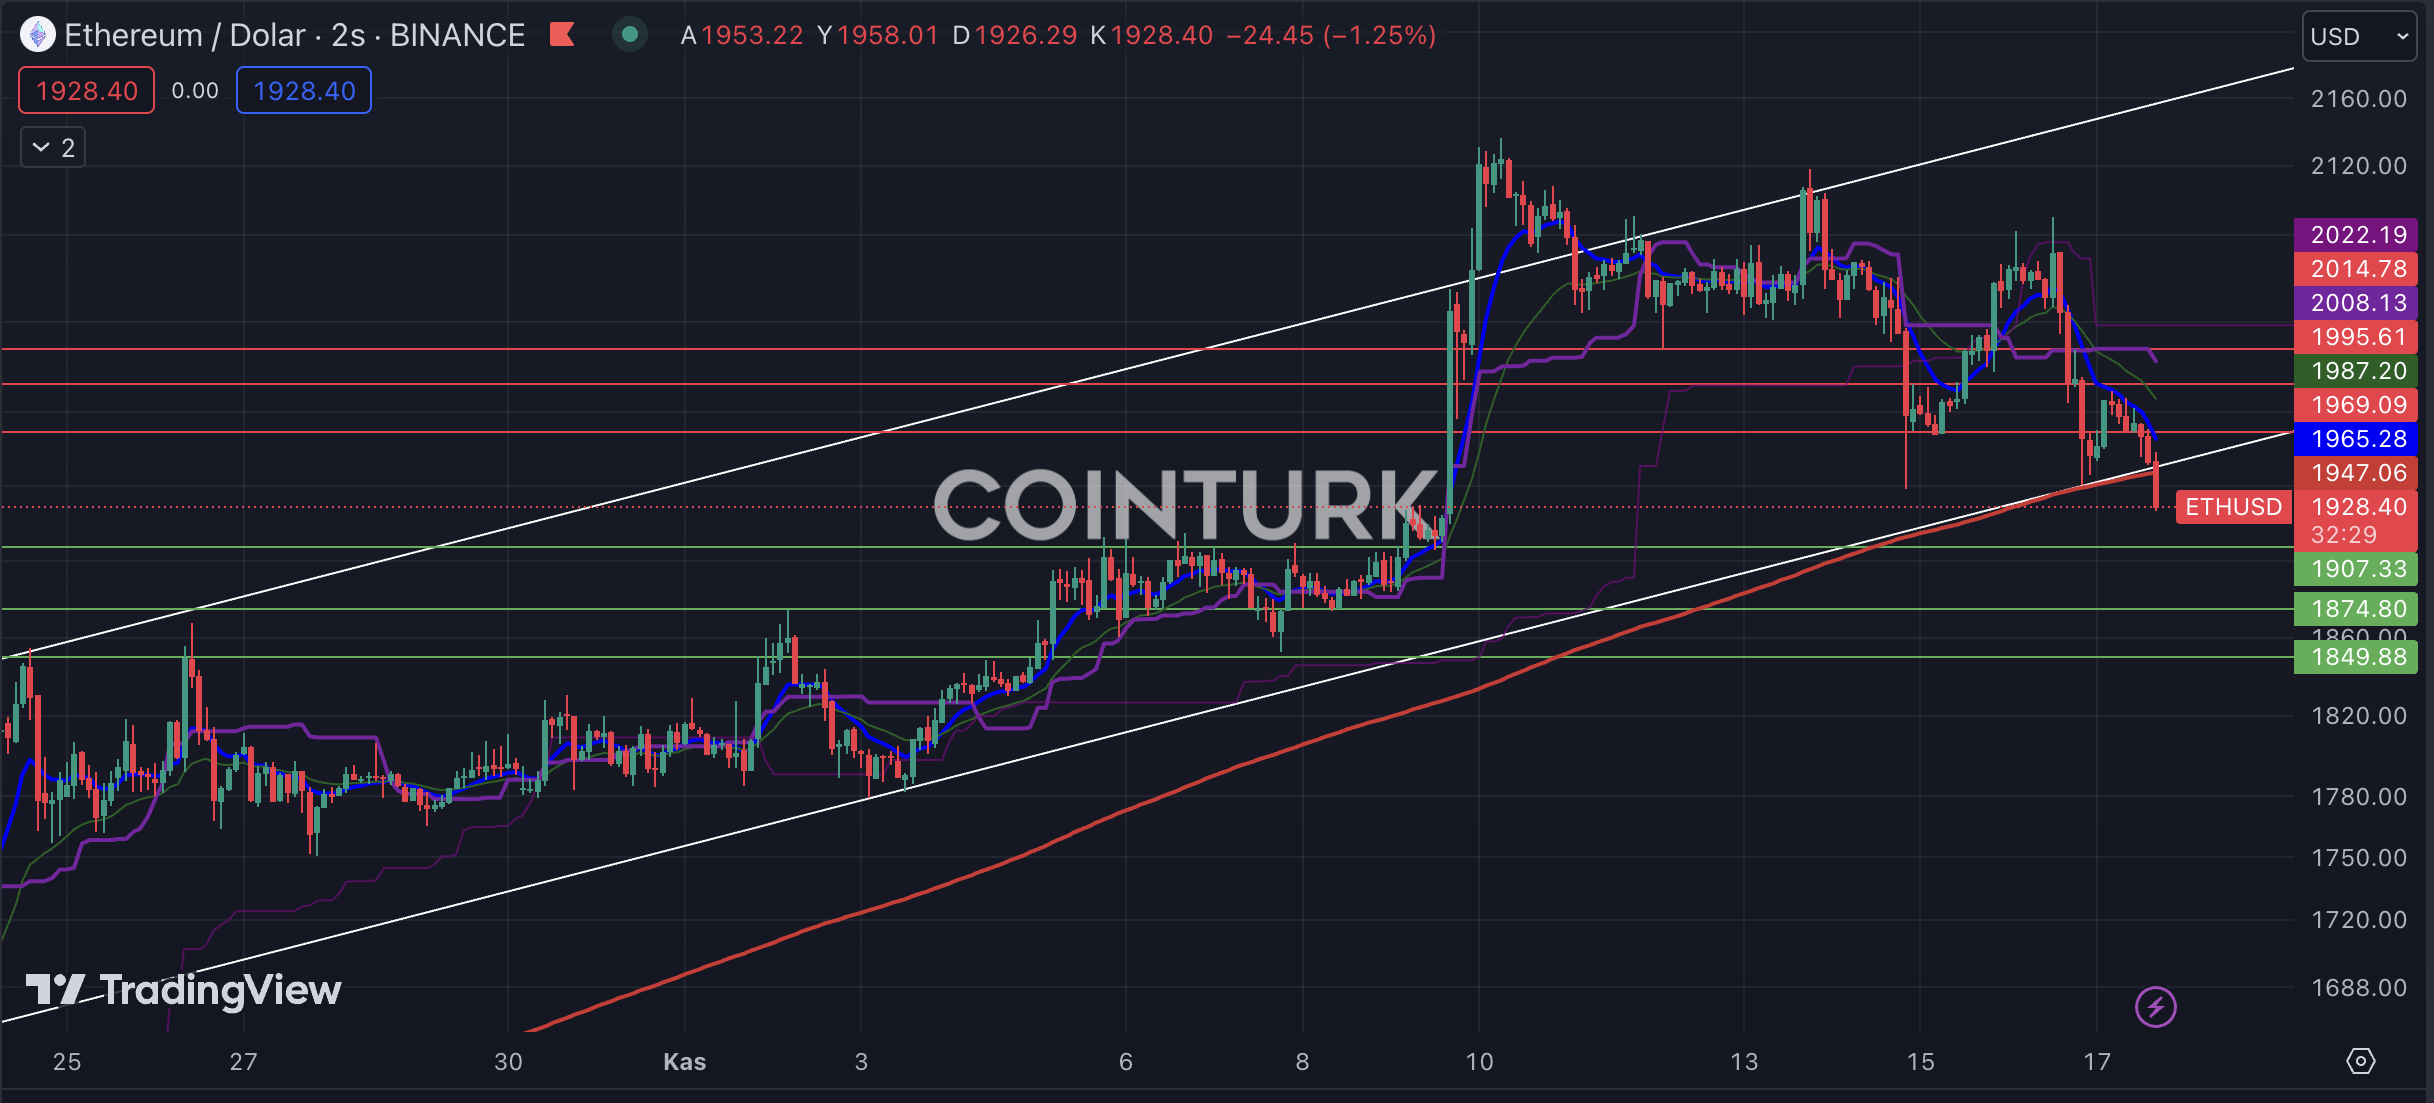
The ascending channel formation on the two-hour chart for Ethereum was a notable structure until the last bar closure. However, with the developments since November 16, the selling pressure continued to increase and the Ethereum price experienced a breakthrough below the support line. Along with this development, the EMA 200 (red line) level was also broken, which can be a serious problem for Ethereum.
The most important support levels to be followed for Ethereum on the two-hour chart are respectively; $1907, $1874, and $1849. Especially, if the bar closes below the $1907 level, which was an important level between November 6 and November 10, it may cause a significant loss of momentum in the Ethereum price.
The most important resistance levels to be considered for Ethereum on the two-hour chart are respectively; $1969, $1995, and $2014. Especially, if the bar closes above the $1969 level in the near future, it will enable Ethereum to return to safe zones.

Read the full article here

