Technical Analysis
Buyers in the Ethereum market have recently driven the price into a strong uptrend, reaching a critical resistance level at $2K. However, encountering a significant hurdle around this crucial mark, there exists the potential for a temporary consolidation correction phase in the coming days.
The Daily Chart
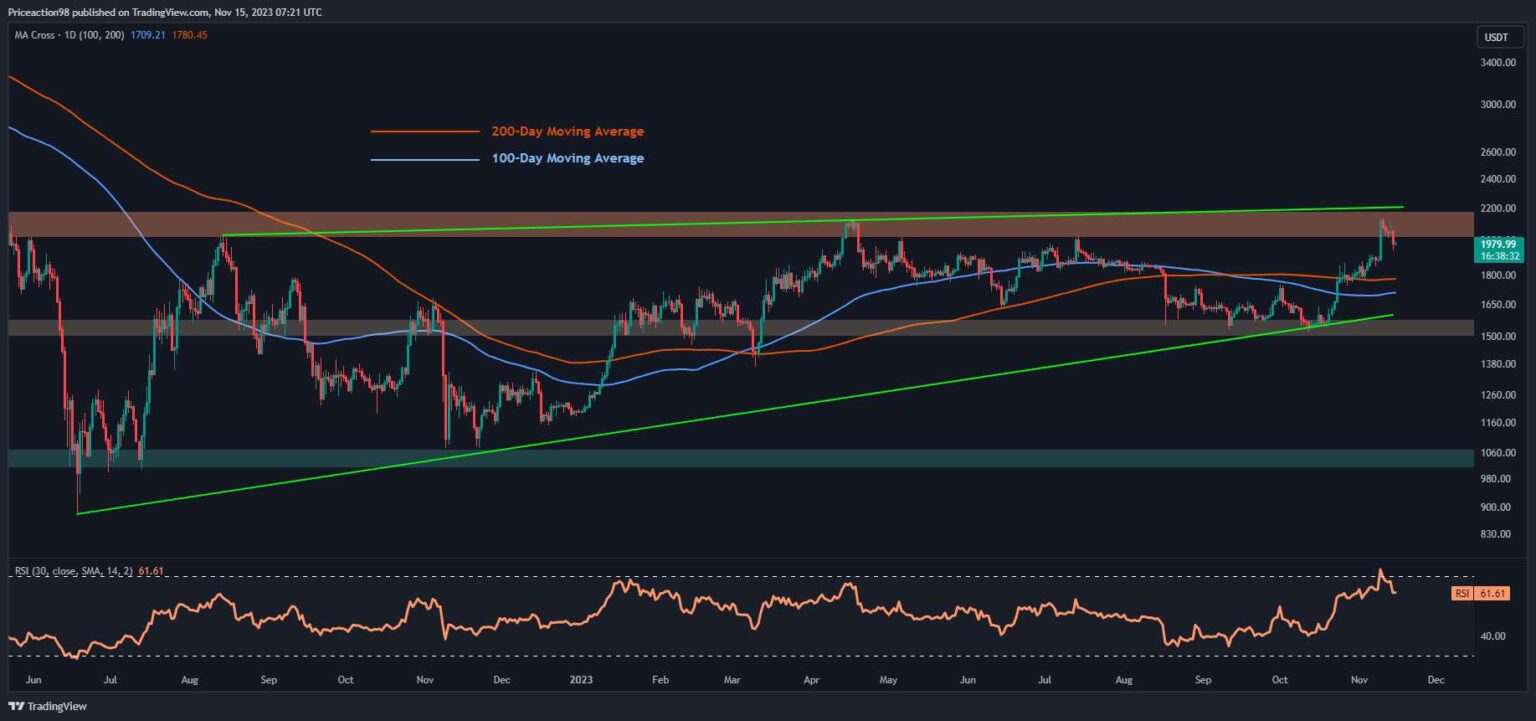
A thorough examination of the daily chart reveals substantial support around the crucial region, comprising the static support at $1,500 and the lower boundary of the wedge pattern. This support fueled a significant surge, indicating strong buying momentum, with buyers targeting the critical $2K resistance zone.
Despite reaching this key level, aligned with the wedge’s upper boundary, Ethereum faced rejection, leading to a slight retracement towards the broken 200-day moving average at $1,783.
Considering the significance of the resistance at $2K and the associated wedge pattern’s upper boundary, a temporary continuation of the ongoing retracement followed by consolidation around the broken moving averages is highly likely. If the price completes a pullback to the broken moving averages, buyers may re-enter the market, aiming once again for the substantial $2K level.
The 4-Hour Chart
On the 4-hour chart, the intensified buying pressure around the $1,5K support region propelled Ethereum toward the substantial $2K resistance. This upward movement demonstrated significant bullish momentum, reflecting the buyers’ dominance in the market.
However, the $2K region represents a crucial psychological resistance, posing challenges for buyers to push the price higher. Notably, a bearish divergence between the price and the RSI indicator suggested insufficient buying pressure, leading to a reversal and slight corrections.
Additionally, a recognizable double-top pattern around this pivotal resistance confirmed the presence of sellers in the short term.
Given the existing market dynamics, there is a high likelihood of an extended consolidation correction phase in the short term. This implies that the market might continue its retracement before definitively determining its next course of action. In this scenario, the support range between the 0.5 and 61.8 levels of the Fibonacci retracement ($1,839 – $1,769) is expected to be the next level of interest for Ethereum’s price.
The futures market has been a significant influencer of Ethereum’s price dynamics, making it imperative for the current uptrend to sustain favorable conditions in this market.
Illustrated in the chart is the 30-day moving average of the Ethereum Taker Buy Sell ratio, a crucial metric for gauging sentiment in the futures market. During a period of substantial price increase in Ethereum, the taker buy-sell ratio exhibited a robust uptrend, signaling strong buying interest. However, a recent reversal in the metric’s trend has led to a downtrend, dipping below the threshold of 1. This reversal indicates that sellers are now executing more aggressive orders in the aggregate, potentially to realize profits or to take short positions.
Significantly, this shift in the metric aligns with the recent market rejection and its struggle to move higher. The confluence of these events suggests a potential for a short-term retracement in Ethereum’s price.
Should the taker buy-sell ratio resume an upward trajectory, surpassing the 1 threshold, it would indicate a revival of bullish sentiment in the short term, potentially supporting the continuation of the uptrend. Conversely, a failure of the metric to exhibit upward movement would raise concerns about the sustainability of any bullish momentum.
Read the full article here

