
- The AUD/NZD is grinding it out on Monday, testing into higher ground.
- The Aussie is rebounding on a technical basis after declining most of November.
- Resistance is piled up, bulls face uphill battle.
The AUD/NZD has climbed nearly 0.6% as the Aussie (AUD) rallies against the Kiwi (NZD) following two straight weeks of declines.
Hourly candles have the AUD/NZD running straight into the 200-hour Simple Moving Average (SMA) just south of 1.0860. The pair was constrained by the 50-hou SMA following early November’s decline from 1.0900, and now the AUD/NZD finds itself trading into the top end of the constraining pattern between the two moving averages.
Monday’s clean break upwards from 1.0780 sees the pair pushing through a descending trendline drawn from November’s peak bids near 1.0940, and the challenge for bidders will be to keep the momentum going.
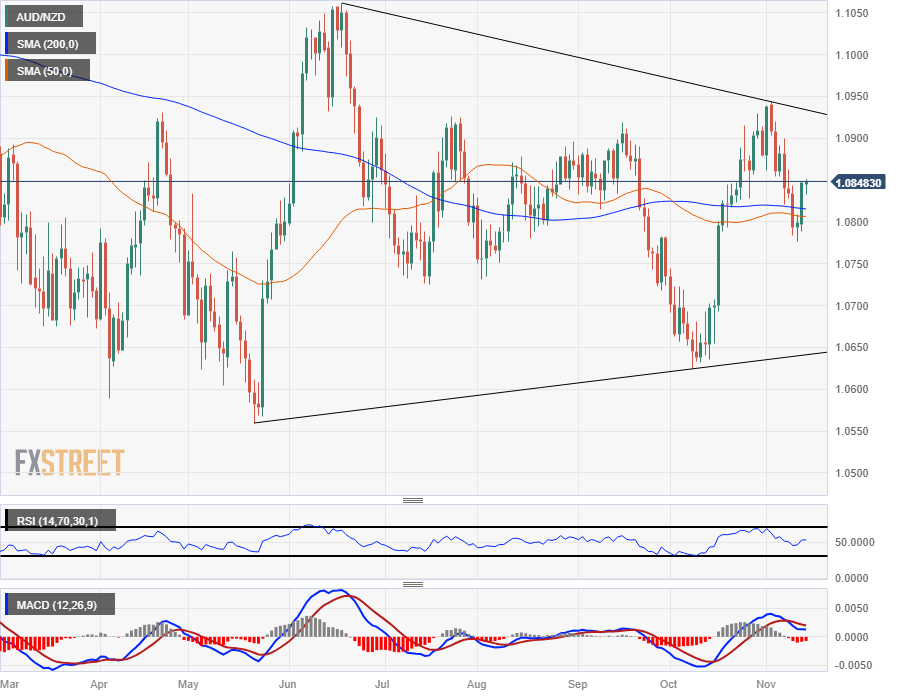
On the daily candlesticks, the AUD/NZD looks set to struggle in the midrange after failing to make a firm downside break of the 200-day SMA, and the long-term trend of the AUD/NZD looks set to remain sideways for the foreseeable future.
AUD/NZD Hourly Chart
AUD/NZD Daily Chart
AUD/NZD Technical Levels
Read the full article here